At a first pass, here’s what I see as the remaining NCAA hockey tournament possibilities:
Secured a bid: Quinnipiac, Minnesota, Miami, Boston College, Mass.-Lowell, North Dakota, New Hampshire
Can get an at-large bid: Yale, Notre Dame, Mankato, Niagara, St. Cloud, Denver, Western Michigan, Union, Wisconsin, Providence, Boston University, Rensselaer, Alaska (.01% chance), Robert Morris
Needs to win the conference tournament: Brown, Colorado College, Ohio St, Michigan, Connecticut, Canisius, Mercyhurst
Fire up the You are the committee and Pairwise predictor calculators and let me know if I missed anything, or let me know if there are particular scenarios you’d like explained. I’ll post another article later that gives some team-by-team analysis.
Updated — more detail on a per-win basis
| Team | PWR Possibilities | ||||||||||||||||||||||||||||||||||||||||||||||||||||||||||||||||||||||||||||||||||||||
|---|---|---|---|---|---|---|---|---|---|---|---|---|---|---|---|---|---|---|---|---|---|---|---|---|---|---|---|---|---|---|---|---|---|---|---|---|---|---|---|---|---|---|---|---|---|---|---|---|---|---|---|---|---|---|---|---|---|---|---|---|---|---|---|---|---|---|---|---|---|---|---|---|---|---|---|---|---|---|---|---|---|---|---|---|---|---|---|
| Overall | By number of wins | ||||||||||||||||||||||||||||||||||||||||||||||||||||||||||||||||||||||||||||||||||||||
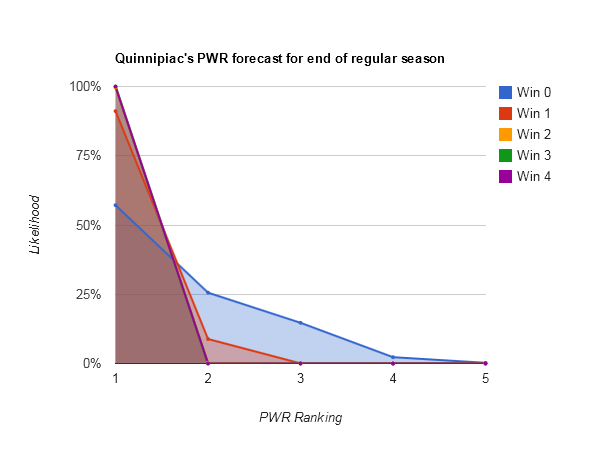
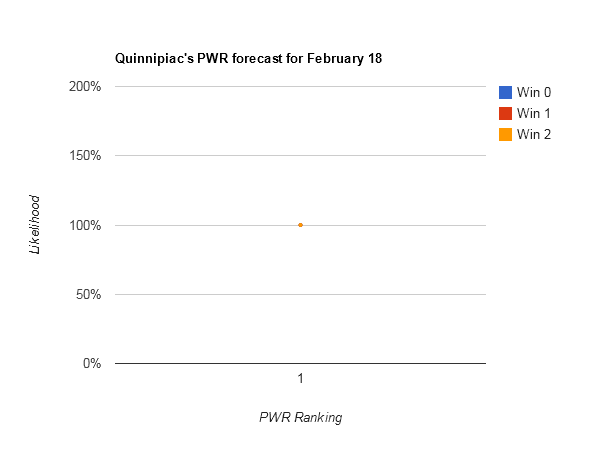
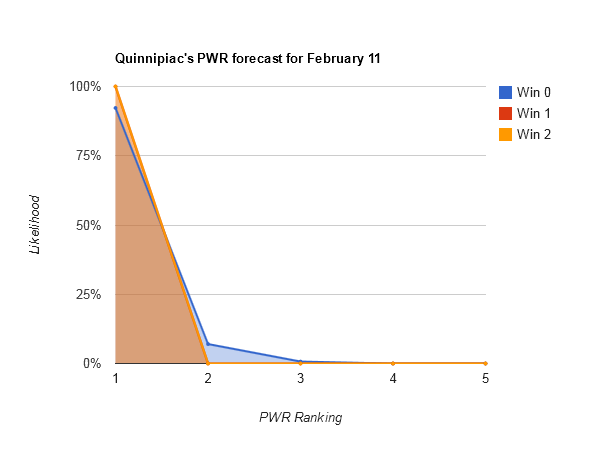
| Quinnipiac | #1 100.0% Tournament invites: 100.0% |
|
|||||||||||||||||||||||||||||||||||||||||||||||||||||||||||||||||||||||||||||||||||||
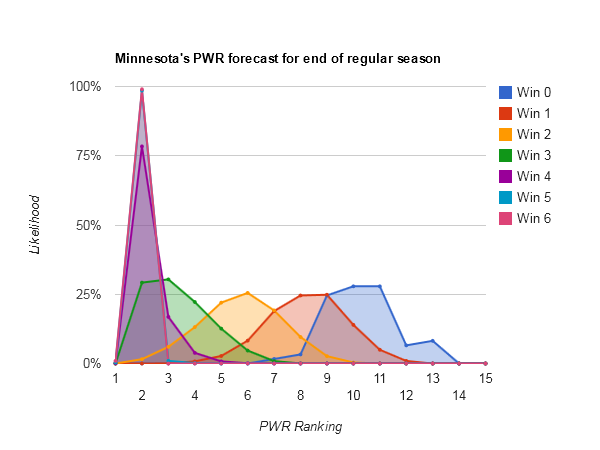
| UMN | #2 100.0% Tournament invites: 100.0% |
|
|||||||||||||||||||||||||||||||||||||||||||||||||||||||||||||||||||||||||||||||||||||
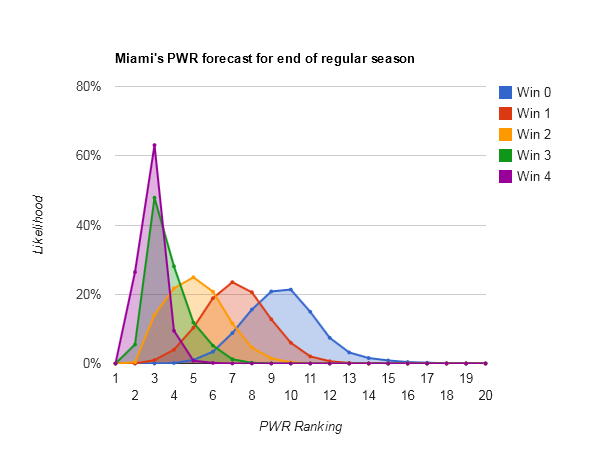
| Miami | #3 49.8% #4 33.8% #5 13.1% #6 3.1% #7 0.2% #8 0.0% Tournament invites: 100.0% |
|
|||||||||||||||||||||||||||||||||||||||||||||||||||||||||||||||||||||||||||||||||||||
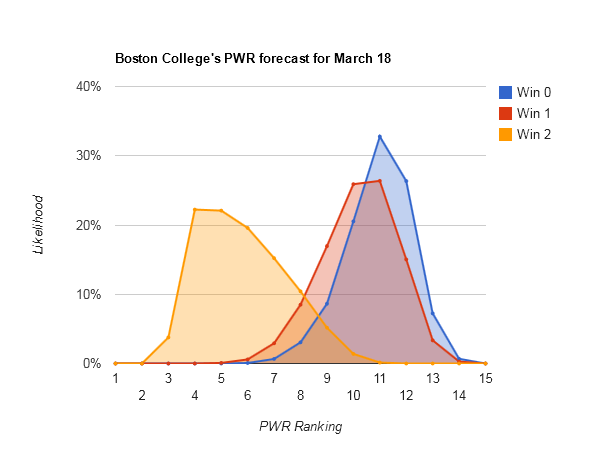
| Boston College | #3 17.6% #4 17.5% #5 22.5% #6 20.8% #7 13.0% #8 5.5% #9 2.0% #10 0.8% #11 0.3% #12 0.0% Tournament invites: 100.0% |
|
|||||||||||||||||||||||||||||||||||||||||||||||||||||||||||||||||||||||||||||||||||||
| Yale | #3 2.1% #4 13.7% #5 15.1% #6 13.6% #7 13.0% #8 10.2% #9 6.2% #10 4.2% #11 3.8% #12 5.1% #13 6.8% #14 5.1% #15 1.0% #16 0.1% #17 0.0% #18 0.0% Tournament invites: 96.9% |
|
|||||||||||||||||||||||||||||||||||||||||||||||||||||||||||||||||||||||||||||||||||||
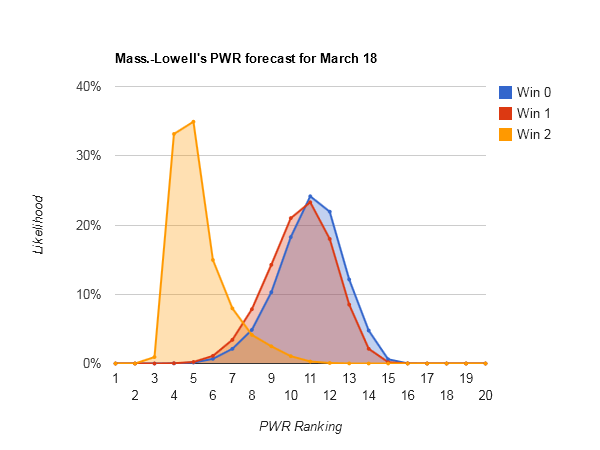
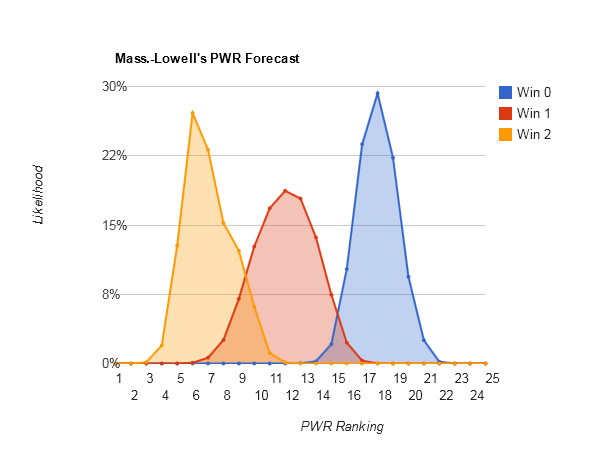
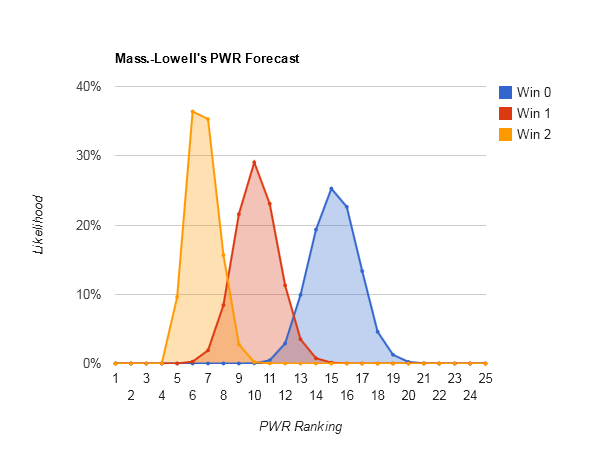
| Mass.-Lowell | #3 18.2% #4 8.2% #5 16.1% #6 24.4% #7 19.4% #8 9.7% #9 3.3% #10 0.7% #11 0.0% Tournament invites: 100.0% |
|
|||||||||||||||||||||||||||||||||||||||||||||||||||||||||||||||||||||||||||||||||||||
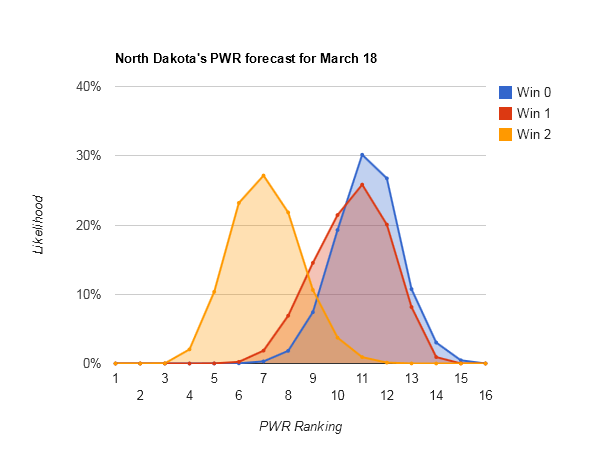
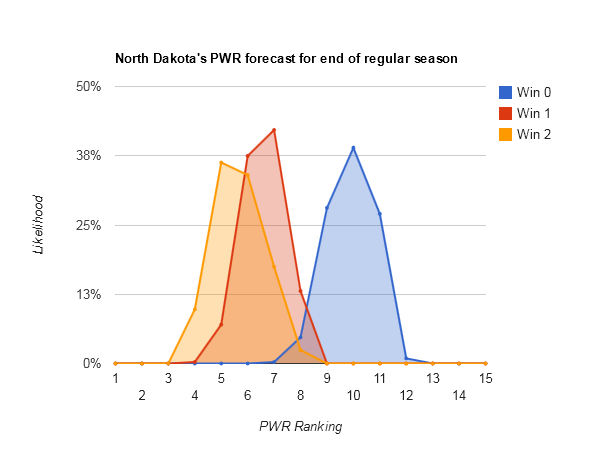
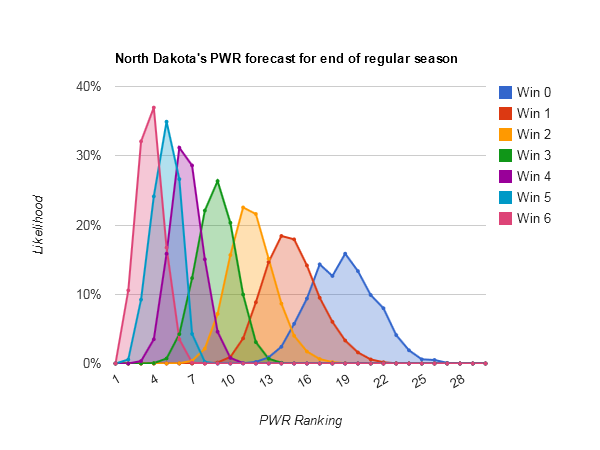
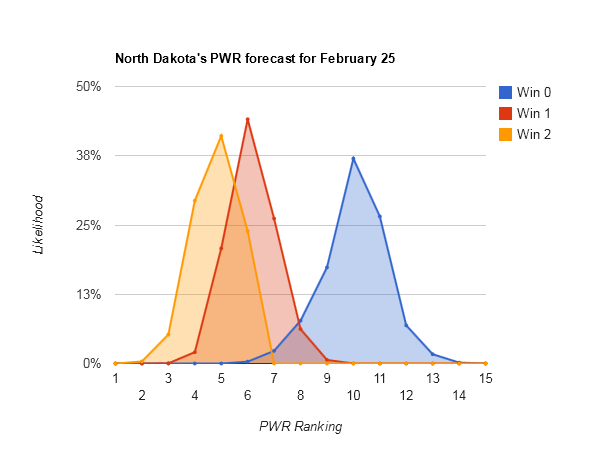
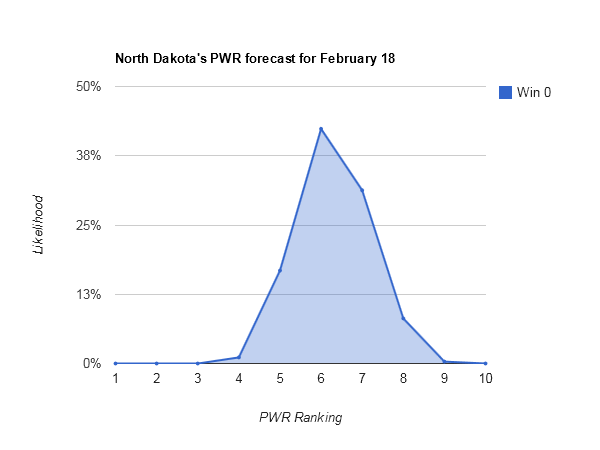
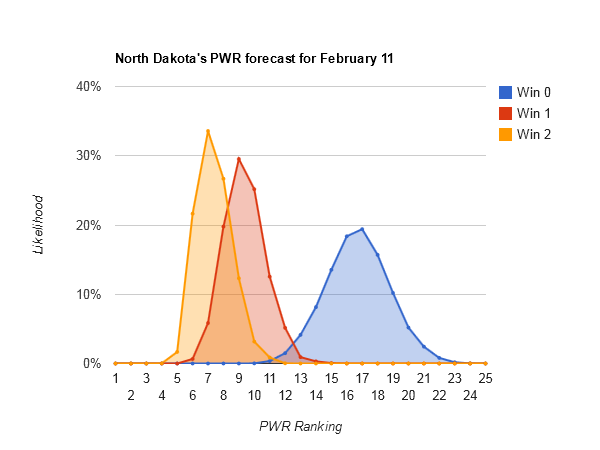
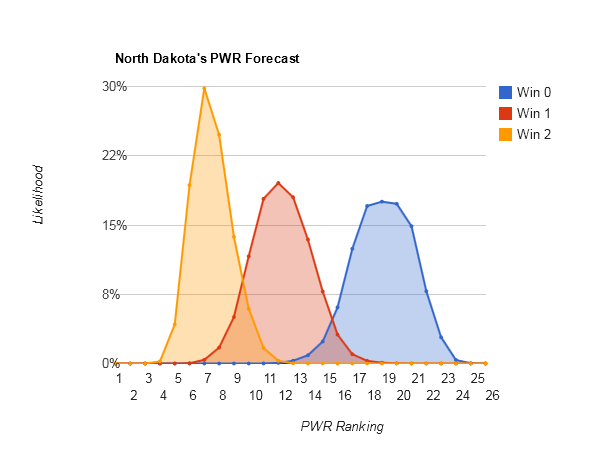
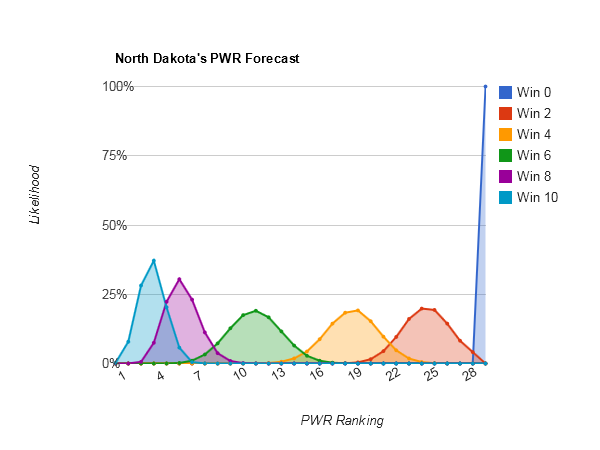
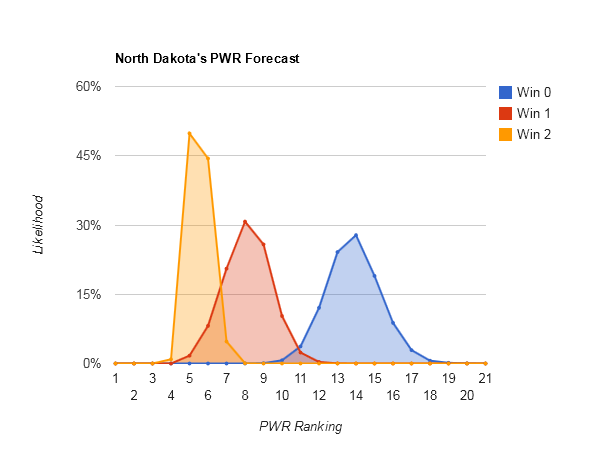
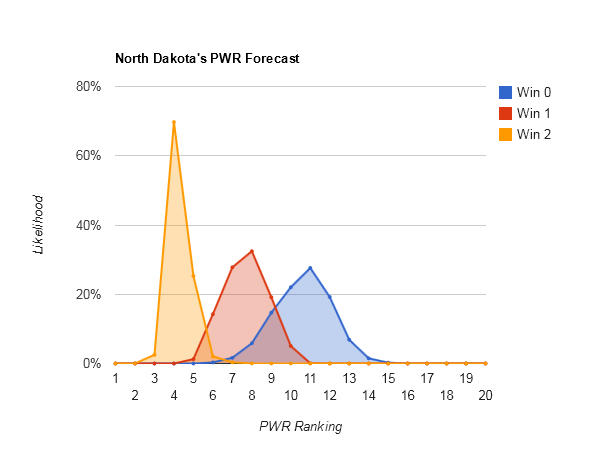
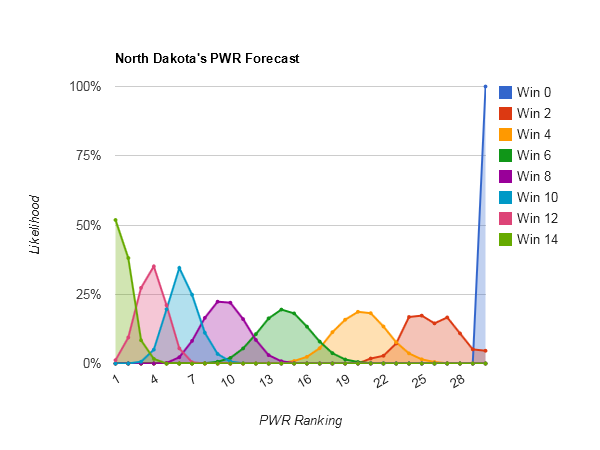
| UND | #3 2.4% #4 6.5% #5 9.5% #6 13.4% #7 22.4% #8 18.9% #9 15.7% #10 9.0% #11 2.2% #12 0.1% Tournament invites: 100.0% |
|
|||||||||||||||||||||||||||||||||||||||||||||||||||||||||||||||||||||||||||||||||||||
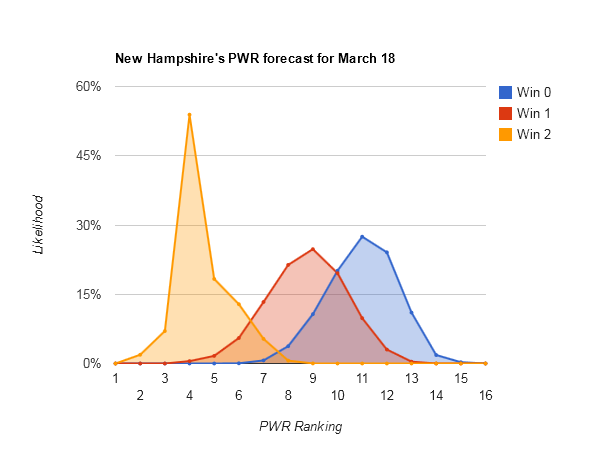
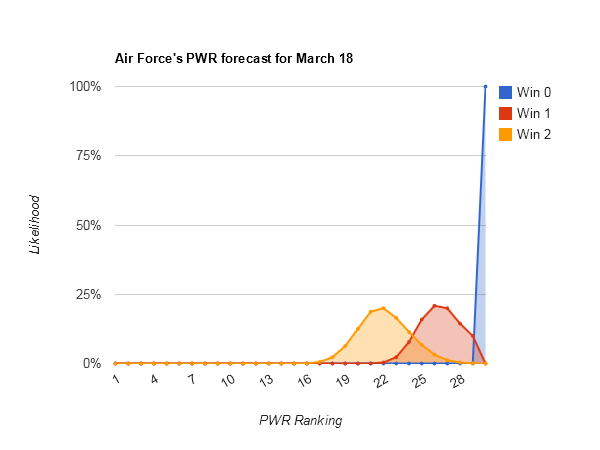
| New Hampshire | #5 0.2% #6 3.9% #7 12.4% #8 34.1% #9 35.7% #10 11.8% #11 1.9% #12 0.1% #13 0.0% Tournament invites: 100.0% |
n/a | |||||||||||||||||||||||||||||||||||||||||||||||||||||||||||||||||||||||||||||||||||||
| Notre Dame | #3 4.6% #4 6.3% #5 2.7% #6 1.3% #7 1.9% #8 2.8% #9 7.0% #10 17.6% #11 13.6% #12 6.3% #13 9.3% #14 6.5% #15 9.7% #16 7.9% #17 2.2% #18 0.3% #19 0.0% Tournament invites: 81.8% |
|
|||||||||||||||||||||||||||||||||||||||||||||||||||||||||||||||||||||||||||||||||||||
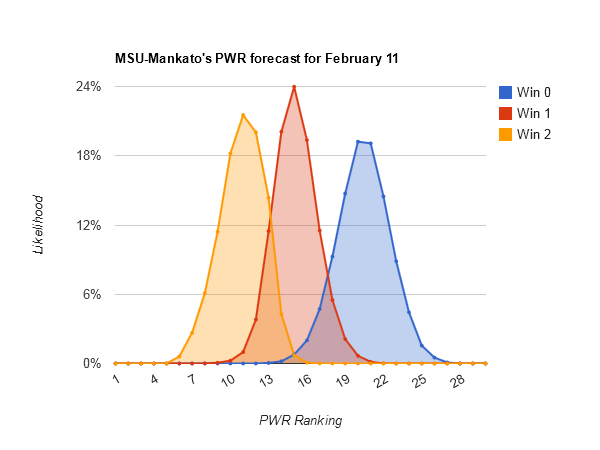
| Mankato | #3 5.2% #4 5.3% #5 3.9% #6 4.5% #7 6.0% #8 9.1% #9 16.6% #10 23.5% #11 17.5% #12 7.2% #13 1.1% #14 0.1% Tournament invites: 99.7% |
|
|||||||||||||||||||||||||||||||||||||||||||||||||||||||||||||||||||||||||||||||||||||
| Niagara | #4 3.9% #5 8.5% #6 8.0% #7 6.1% #8 4.7% #9 4.7% #10 7.4% #11 14.3% #12 21.7% #13 18.4% #14 2.2% #15 0.1% Tournament invites: 95.9% |
|
|||||||||||||||||||||||||||||||||||||||||||||||||||||||||||||||||||||||||||||||||||||
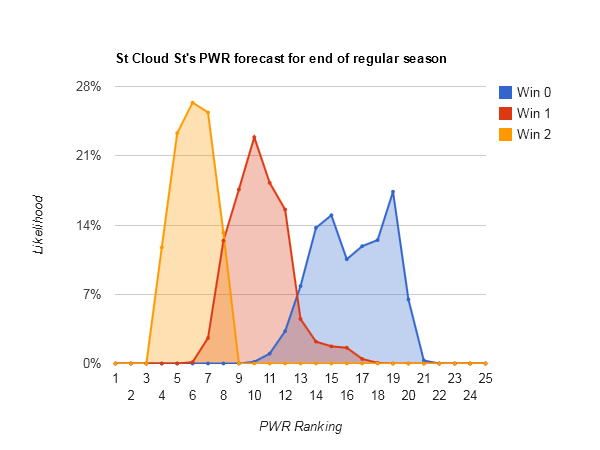
| SCSU | #3 0.1% #4 4.8% #5 8.5% #6 7.0% #7 5.5% #8 4.7% #9 4.6% #10 7.4% #11 10.3% #12 19.6% #13 21.0% #14 6.0% #15 0.6% Tournament invites: 94.1% |
|
|||||||||||||||||||||||||||||||||||||||||||||||||||||||||||||||||||||||||||||||||||||
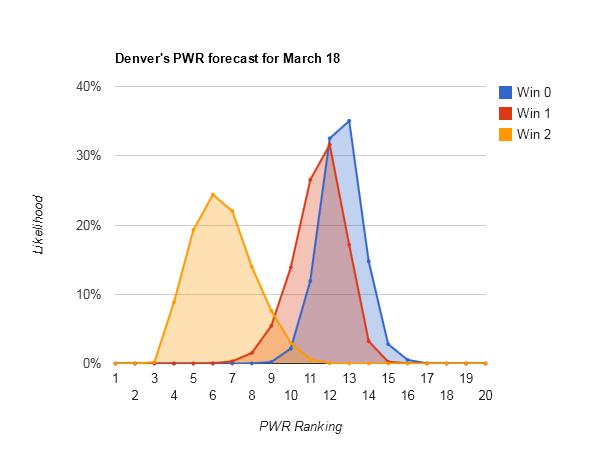
| Denver | #7 0.0% #8 0.3% #9 4.2% #10 16.9% #11 32.1% #12 31.2% #13 14.9% #14 0.3% #15 0.0% Tournament invites: 98.0% |
n/a | |||||||||||||||||||||||||||||||||||||||||||||||||||||||||||||||||||||||||||||||||||||
| Western Michigan | #13 13.5% #14 55.7% #15 26.5% #16 4.2% #17 0.1% #18 0.0% Tournament invites: 56.5% |
n/a | |||||||||||||||||||||||||||||||||||||||||||||||||||||||||||||||||||||||||||||||||||||
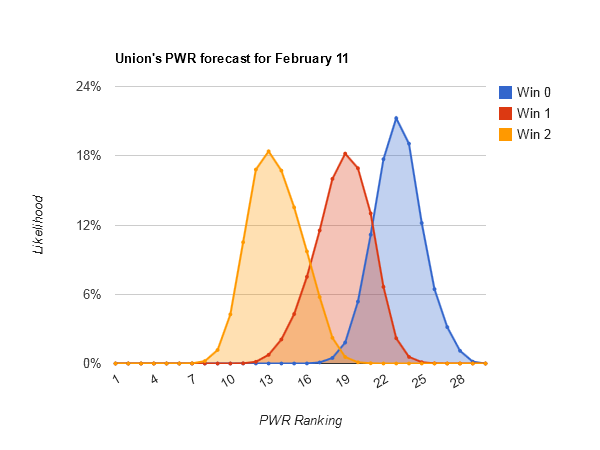
| Union | #8 0.0% #9 0.1% #10 0.5% #11 2.7% #12 7.2% #13 9.5% #14 12.2% #15 28.6% #16 24.4% #17 6.5% #18 4.3% #19 2.6% #20 1.2% #21 0.2% #22 0.0% Tournament invites: 41.5% |
|
|||||||||||||||||||||||||||||||||||||||||||||||||||||||||||||||||||||||||||||||||||||
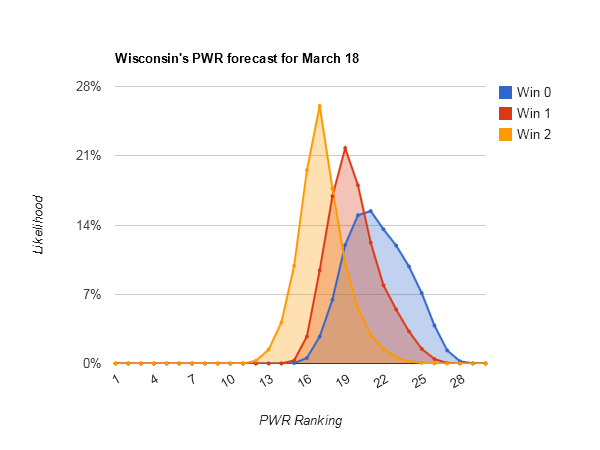
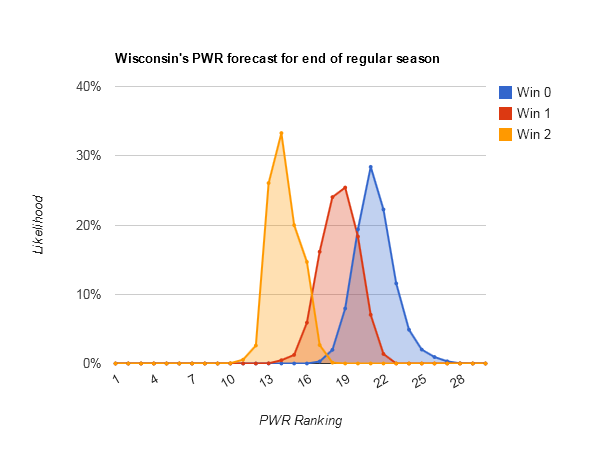
| UW | #10 0.2% #11 1.2% #12 1.6% #13 2.4% #14 4.7% #15 3.7% #16 5.1% #17 11.8% #18 21.1% #19 20.0% #20 14.6% #21 9.7% #22 3.7% #23 0.2% Tournament invites: 13.3% |
|
|||||||||||||||||||||||||||||||||||||||||||||||||||||||||||||||||||||||||||||||||||||
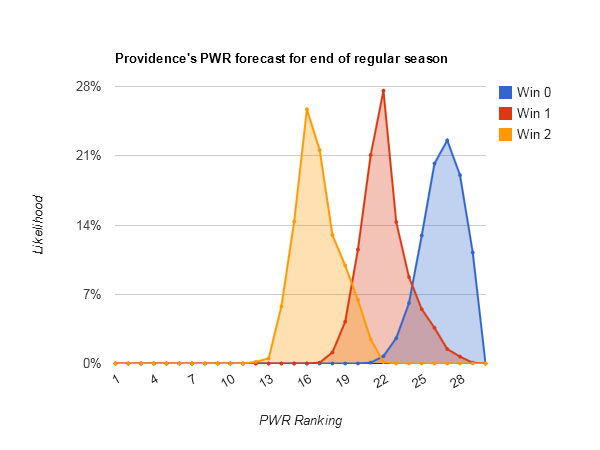
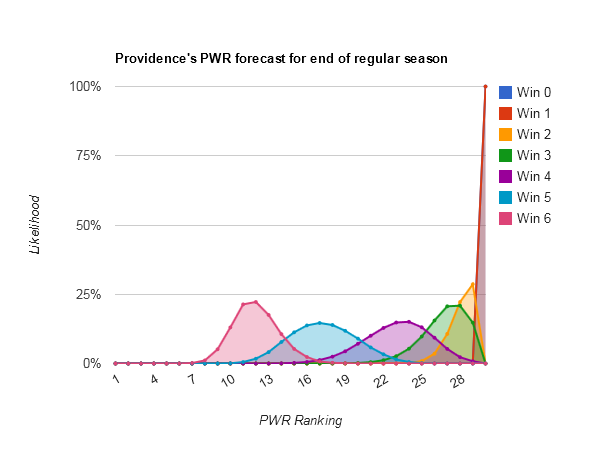
| Providence | #13 0.0% #14 0.9% #15 7.3% #16 9.2% #17 8.4% #18 10.8% #19 14.2% #20 15.2% #21 12.0% #22 8.8% #23 7.7% #24 4.0% #25 1.3% #26 0.1% Tournament invites: 25.1% |
|
|||||||||||||||||||||||||||||||||||||||||||||||||||||||||||||||||||||||||||||||||||||
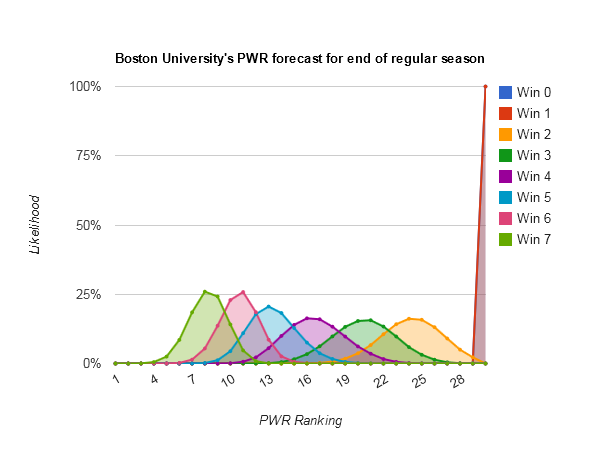
| Boston University | #12 0.0% #13 2.7% #14 4.5% #15 12.2% #16 8.8% #17 9.3% #18 15.1% #19 22.8% #20 15.6% #21 7.0% #22 1.8% #23 0.1% Tournament invites: 25.8% |
|
|||||||||||||||||||||||||||||||||||||||||||||||||||||||||||||||||||||||||||||||||||||
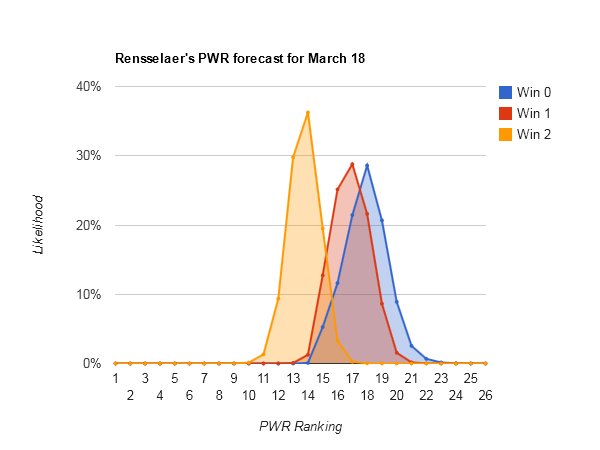
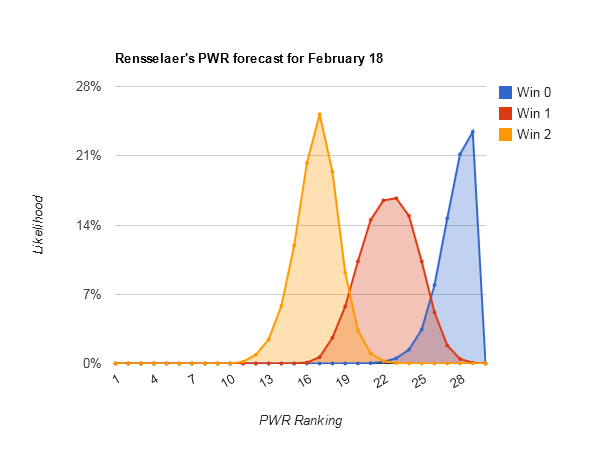
| Rensselaer | #13 0.3% #14 1.8% #15 9.8% #16 31.2% #17 31.9% #18 17.3% #19 6.0% #20 1.5% #21 0.2% Tournament invites: 8.2% |
n/a | |||||||||||||||||||||||||||||||||||||||||||||||||||||||||||||||||||||||||||||||||||||
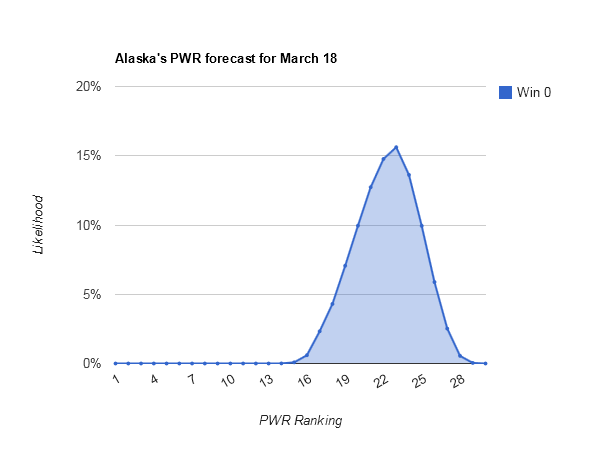
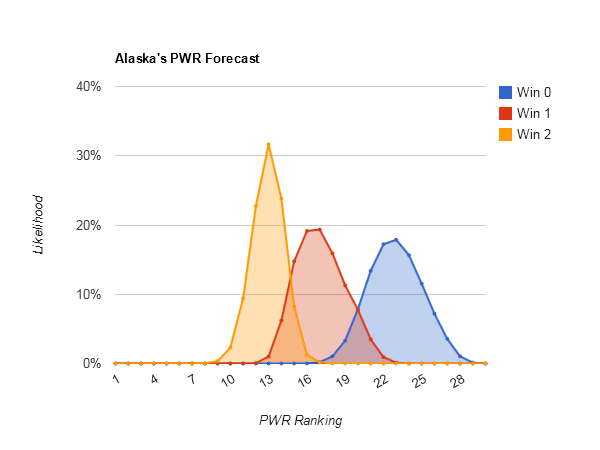
| Alaska | #16 0.3% #17 2.6% #18 7.2% #19 12.1% #20 14.3% #21 13.7% #22 13.5% #23 15.1% #24 13.3% #25 6.5% #26 1.3% #27 0.1% Tournament invites: < 1% |
n/a | |||||||||||||||||||||||||||||||||||||||||||||||||||||||||||||||||||||||||||||||||||||
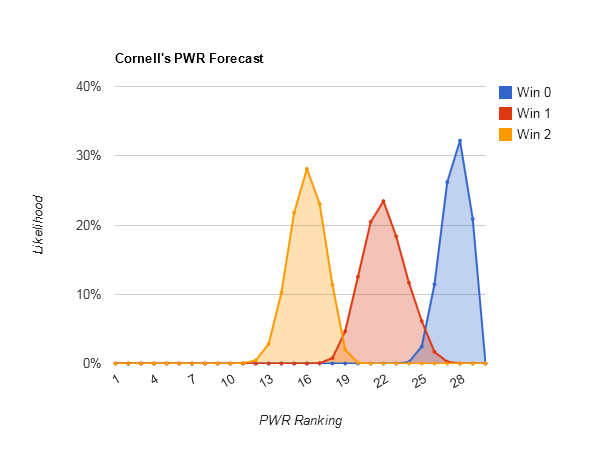
| Cornell | #18 0.2% #19 2.1% #20 3.8% #21 5.4% #22 11.3% #23 23.5% #24 29.3% #25 19.6% #26 4.5% #27 0.3% Tournament invites: 0.0% |
n/a | |||||||||||||||||||||||||||||||||||||||||||||||||||||||||||||||||||||||||||||||||||||
| Brown | #16 0.2% #17 2.4% #18 6.4% #19 10.5% #20 17.4% #21 20.4% #22 15.4% #23 6.4% #24 6.3% #25 6.9% #26 5.8% #27 1.7% #28 0.2% #29 0.0% Tournament invites: 25.0% |
|
|||||||||||||||||||||||||||||||||||||||||||||||||||||||||||||||||||||||||||||||||||||
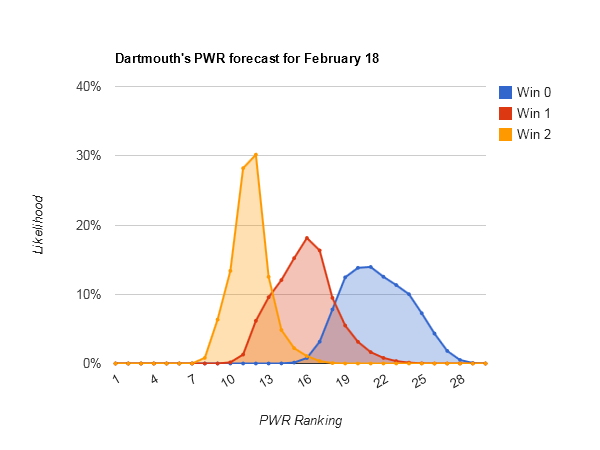
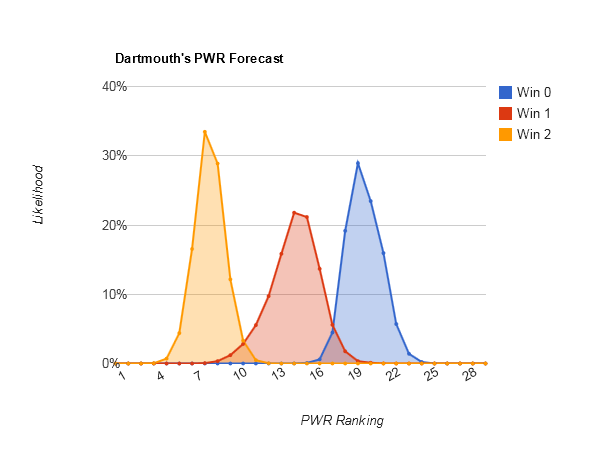
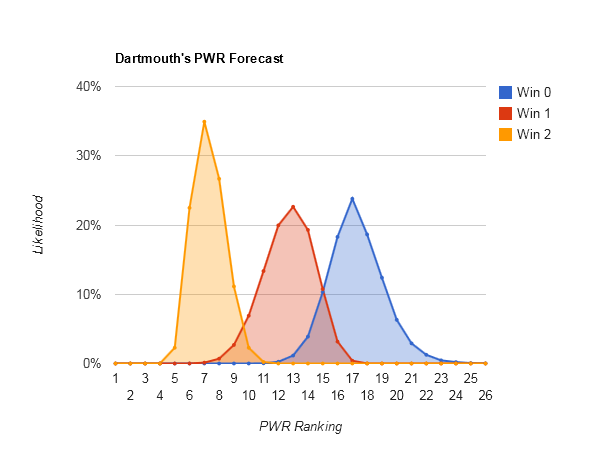
| Dartmouth | #18 0.2% #19 2.2% #20 8.8% #21 20.6% #22 31.3% #23 24.5% #24 10.8% #25 1.7% Tournament invites: 0.0% |
n/a | |||||||||||||||||||||||||||||||||||||||||||||||||||||||||||||||||||||||||||||||||||||
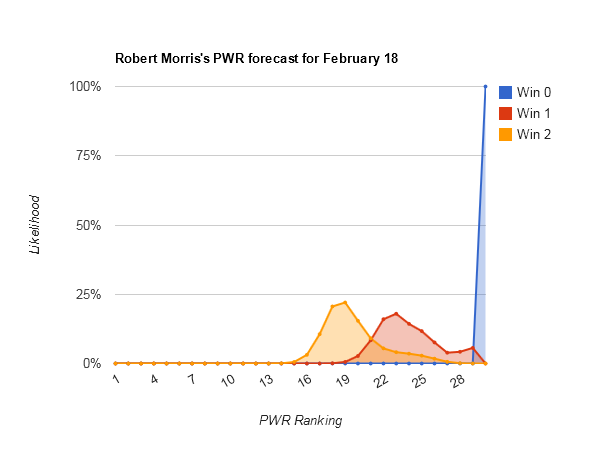
| Robert Morris | #14 0.0% #15 0.6% #16 8.6% #17 24.4% #18 14.4% #19 2.9% #20 1.7% #21 3.1% #22 5.1% #23 7.6% #24 14.3% #25 13.1% #26 3.8% #27 0.5% Tournament invites: 0.7% |
n/a | |||||||||||||||||||||||||||||||||||||||||||||||||||||||||||||||||||||||||||||||||||||
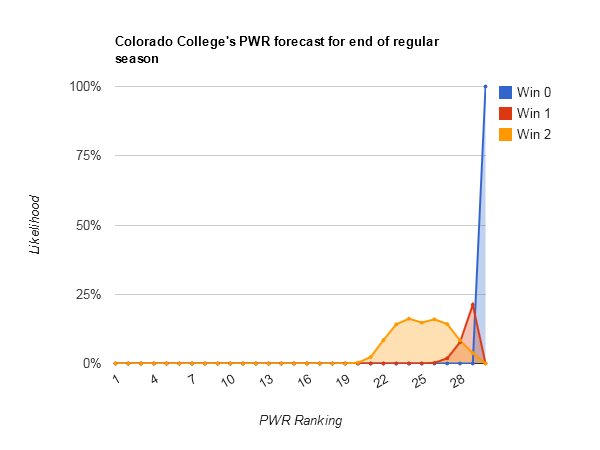
| CC | #18 0.2% #19 0.8% #20 1.6% #21 2.6% #22 3.4% #23 5.1% #24 7.1% #25 13.8% #26 16.4% #27 16.5% #28 22.0% #29 8.0% #30 2.2% #31 0.5% #32 0.0% Tournament invites: 12.5% |
|
|||||||||||||||||||||||||||||||||||||||||||||||||||||||||||||||||||||||||||||||||||||
| Ohio State | #17 0.5% #18 2.4% #19 3.7% #20 4.4% #21 4.8% #22 5.1% #23 6.4% #24 4.4% #25 4.3% #26 6.4% #27 6.5% #28 19.7% #29 21.2% #30 3.3% #31 6.2% #32 0.7% Tournament invites: 25.0% |
|
|||||||||||||||||||||||||||||||||||||||||||||||||||||||||||||||||||||||||||||||||||||
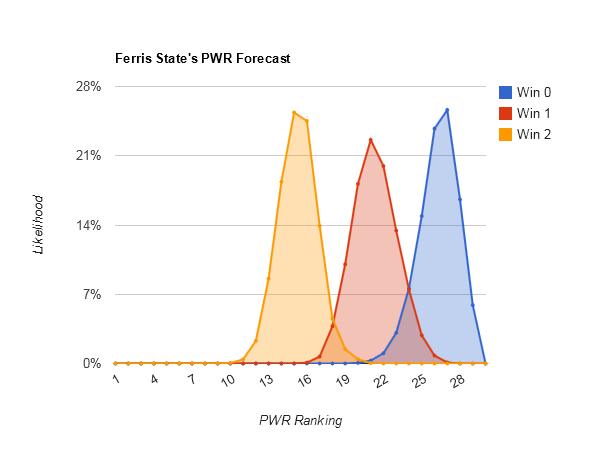
| Ferris State | #25 8.5% #26 26.5% #27 36.1% #28 22.8% #29 5.7% #30 0.4% Tournament invites: 0.0% |
n/a | |||||||||||||||||||||||||||||||||||||||||||||||||||||||||||||||||||||||||||||||||||||
| St. Lawrence | #24 0.0% #25 5.3% #26 21.8% #27 32.1% #28 25.2% #29 12.0% #30 2.8% #31 0.7% Tournament invites: 0.0% |
n/a | |||||||||||||||||||||||||||||||||||||||||||||||||||||||||||||||||||||||||||||||||||||
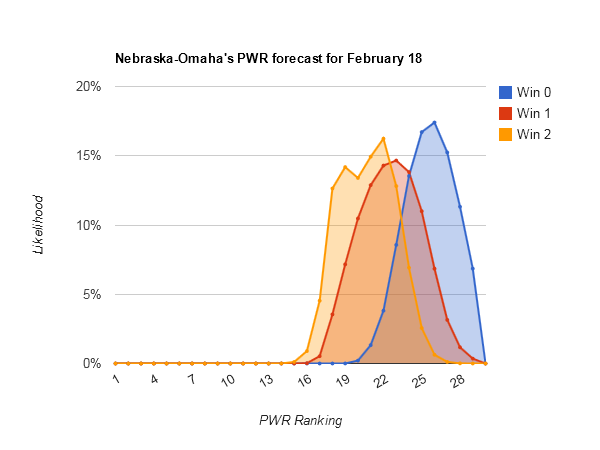
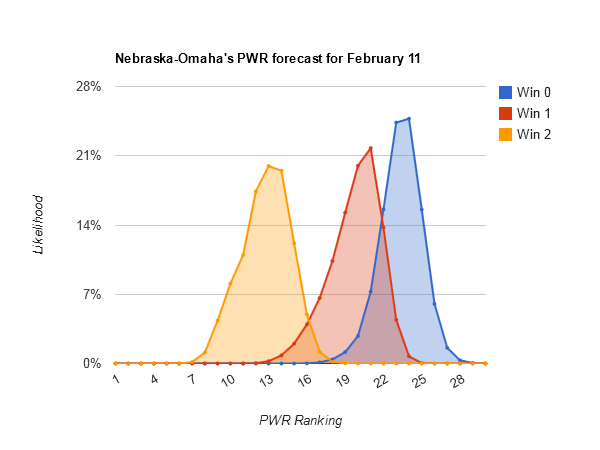
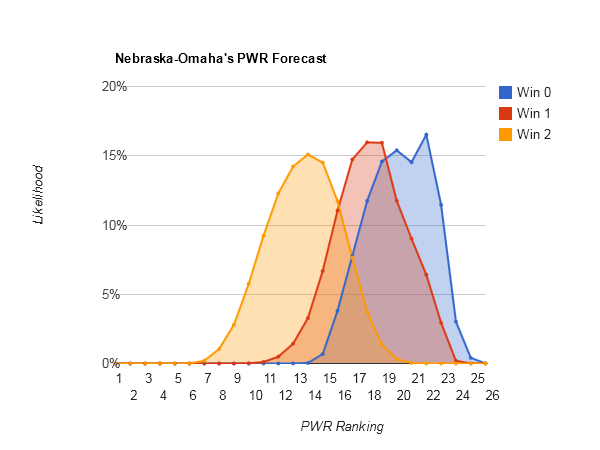
| Nebraska-Omaha | #27 0.0% #28 0.0% #29 20.9% #30 38.3% #31 26.6% #32 14.2% Tournament invites: 0.0% |
n/a | |||||||||||||||||||||||||||||||||||||||||||||||||||||||||||||||||||||||||||||||||||||
| Michigan | #21 0.0% #22 0.3% #23 2.0% #24 6.7% #25 11.5% #26 4.7% #27 3.2% #28 8.1% #29 10.9% #30 2.1% #31 1.6% #32 0.7% Non-TUC 48.2% Tournament invites: 25.0% |
|
|||||||||||||||||||||||||||||||||||||||||||||||||||||||||||||||||||||||||||||||||||||
| Connecticut | #21 0.1% #22 0.3% #23 1.4% #24 4.0% #25 7.5% #26 8.8% #27 2.9% #28 0.0% #29 7.0% #30 8.3% #31 5.7% #32 4.0% Non-TUC 49.9% Tournament invites: 25.0% |
|
|||||||||||||||||||||||||||||||||||||||||||||||||||||||||||||||||||||||||||||||||||||
| Holy Cross | #26 0.0% #27 0.2% #28 1.9% #29 14.3% #30 42.7% #31 34.9% #32 6.0% Tournament invites: 0.0% |
n/a | |||||||||||||||||||||||||||||||||||||||||||||||||||||||||||||||||||||||||||||||||||||
| Canisius | Non-TUC 100.0% Tournament invites: 25.0% |
|
|||||||||||||||||||||||||||||||||||||||||||||||||||||||||||||||||||||||||||||||||||||
| Mercyhurst | #32 0.0% Non-TUC 100.0% Tournament invites: 25.0% |
|
|||||||||||||||||||||||||||||||||||||||||||||||||||||||||||||||||||||||||||||||||||||
Methodology
Unlike the regular season forecasts which are based on monte carlo simulations, the above tables were produced by exhaustively searching all remaining possible outcomes, so the table should be complete. The probabilities presented in the forecasts are the share of remaining possible outcomes in which that event occurs. The predictions about the likelihood of a team making the NCAA tournament assume that the PWR rankings will perfectly mimic the NCAA selection process, as they have in the past, and that any ties will be broken by RPI.
Resources
- You are the Committee calculator (CollegeHockeyNews.com)
- Pairwise Predictor (USCHO.com)
- Current PWR Rankings (SiouxSports.com)
- Current RPI Rankings (SiouxSports.com)
- CHN PWR Rankings (CollegeHockeyNews.com)
- TBRW build your own rankings (slack.net)
- Explanation of how PWR mimics NCAA tournament selection (CollegeHockeyNews.com)