January is the typical time to start paying attention to the PairWise Rankings (PWR) that mimic that NCAA’s tournament selection criteria. UND is currently ranked #7, and is poised to move this weekend with a pair of contests against arch-rival Minnesota.
North Dakota – Gophers
Both are highly ranked, Minnesota #4 and UND #7. However, the weekend’s games have only minor short term implications for Minnesota, but more significant short term implications for North Dakota if either team sweeps.
The following charts are the forecast likelihoods of each PWR ranking as of next Monday (Jan 21) for each team based on its own performance this weekend.

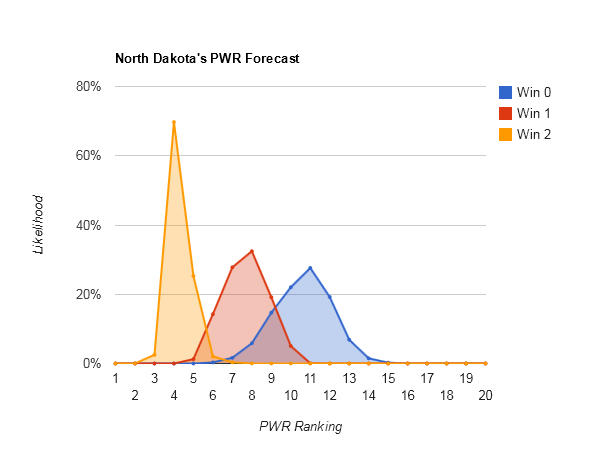
North Dakota’s remaining season
North Dakota seems pretty well positioned to make the tournament. Going about .500 over the rest of the regular season would likely leave UND in position for an at-large bid going into the conference tournaments.
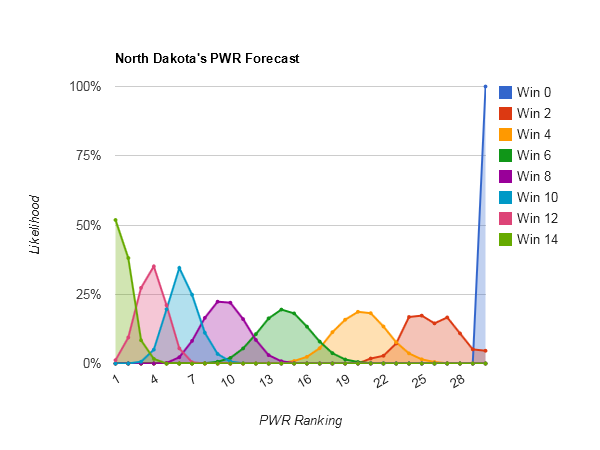
The following chart contains the forecast likelihoods of each PWR ranking as of the end of the regular season for UND based on its own performance over the remainder of the regular season.
Minnesota’s remaining season
“Numbers” on the USCHO forum asserted that Minnesota’s 8-0-0 non-conference record particularly shores up their PWR ranking because of the Common OPponents criterion.

It seems true that running the rest of the season even under .500 would still leave Minnesota in a good position heading into the conference tournaments. Minnesota’s strength in COP does help, but once TUC is in play you still need to win one more criterion to take the comparison. Opponents’ strength held constant, going .500 would drop Minnesota’s RPI to about .555, a far more pedestrian number. Minnesota’s respectable TUC helps them in that regard, further supporting their lofty rating down the road.
TUC is coming into play
A lot of teams are just starting to hit 10 games vs. other Teams Under Consideration (TUCs), bringing that criterion into play in as-of-now PWR calculations (which, frankly, additionally reveals how absurd as-of-now calculations are; because we know most of these teams will hit 10 games vs. TUCs by the end).
The top 10 teams’ records vs TUCs are somewhat predictive:
| Team | Record vs TUCs |
|---|---|
| 1. New Hampshire | .7500 |
| 2. Boston College | .6667 |
| 3. Quinnipiac | .8077 |
| 4. Minnesota | .6875 |
| 5. Notre Dame | .6364 |
| 6. Boston University | .4000 |
| 7. North Dakota | .5000 |
| 8. Denver | .5938 |
| 9. Yale | .5000 |
| 10. Miami | .6667 |
Indeed, Minnesota’s good TUC record is part of what helps insulate it a bit from big downward movement. But that’s true of all the top few teams.
The two most exceptional seem to be Quinnipiac, whose TUC record does seem to provide a fair amount of insurance against big downward moves; and Boston University, whose low TUC means it will take a strong effort down the stretch to maintain their current ranking.


Boston University is a particularly interesting case. Despite their dismal TUC, they’re currently #6 in the PWR on the back of the #1 strength of schedule in RPI. Looking at BU’s RPI details, it would take a noticeable increase in winning percentage (to about .800 over the remainder of the season vs. about .632 to date) to offset their upcoming decline in SOS and keep RPI constant. Short of that, expect BU’s RPI to fall and their PWR with it.
Of course, those TUC records can change not only based on teams’ own upcoming performances, but as former opponents play additional games that may add or remove them from being “under consideration”.
Methodology
Each forecast is based on at least one million monte carlo simulations of the games in the described period. For each simulation, the PairWise Ranking (PWR) is calculated and the results tallied. The probabilities presented in the forecasts are the share of simulations in which a particular outcome occurred.
The outcome of each game in each simulation is determined by random draw, with the probability of victory for each team set by their relative KRACH ratings. So, if the simulation set included a contest between team A with KRACH 300 and team B with KRACH 100, team A will win the game in very close to 75% of the simulations. I don’t simulate ties or home ice advantage.
Closing remarks
This is my first stab at firing up the PWR simulations and writing this sort of post this year. It does always seem to take me a little while to get back into the groove, so please point out any errors, questions, or points that need clarifying.
Though I started with an analysis of UND’s position, let me know if there’s anything else in particular that you’d like to see.
Resources
- Current PWR Rankings (SiouxSports.com)
- Current RPI Rankings (SiouxSports.com)
- CHN PWR Rankings (CollegeHockeyNews.com)
- TBRW build your own rankings (slack.net)
- Explanation of how PWR mimics NCAA tournament selection (CollegeHockeyNews.com)
(currently down?)