PWR forecast for Mar. 8

It’s that time of year, the season is winding down, and the number of remaining possible outcomes is declining dramatically, such that the PWR is becoming much more predictable. PWR aficionados know that in coming weeks the “You are the Committee” calculators (which allow you to punch in game outcomes and give you back the resultant PWR) will be coming online, so keep an eye out for those.

Last year I assumed this column would quite serving a purpose at that point, but quickly realized that the simulator is actually pretty good at finding the most extreme cases (e.g. UND could still finish #3 with this set of highly improbably outcomes), so this probably isn’t the end of these posts quite yet…

On to business…

Review last week

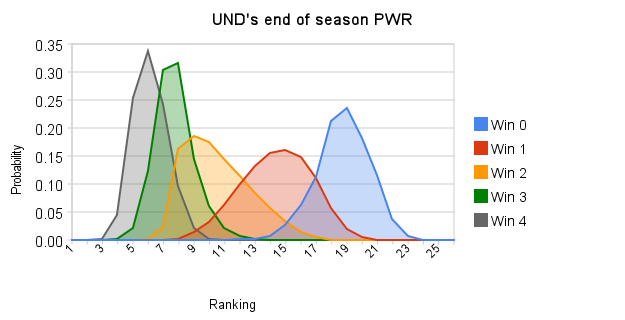
UND is #6 in PWR having one two. Referring to last week’s forecast, another solid hit.

The main event

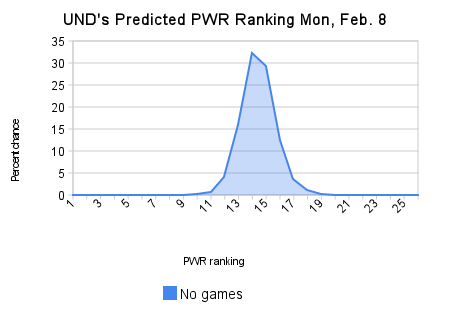
This forecast has, by far, the tallest spikes of the season. PWR isn’t moving much this weekend.

How can UND end the weekend at #4

A bonus section… I analyzed those outcomes in which UND ends the weekend as #4, and hence would be slotted as a #1 seed. The following game outcomes were present in every such scenario. For the economists out there, these are necessary but not sufficient conditions (i.e. these outcomes alone won’t guarantee a #4 ranking, but the absence of these outcomes pretty much guarantees UND won’t have a #4 ranking):

UND must sweep Tech
Mankato needs at least 1 point vs SCSU
UNH needs at least 1 point vs BC

Other games to watch

These outcomes seem to help the Sioux in the widest variety of scenarios (that is, not just those in which UND sweeps and is fighting for a #4 ranking):

Mankato sweeping SCSU
Denver sweeping CC
Maine sweeping Mass
Alabama-Huntsville sweeping Bemidji St
UNH sweeping BC

I won’t try to figure out why each of those games matters here, but such discussions often crop up in the PWR Rankings forum thread

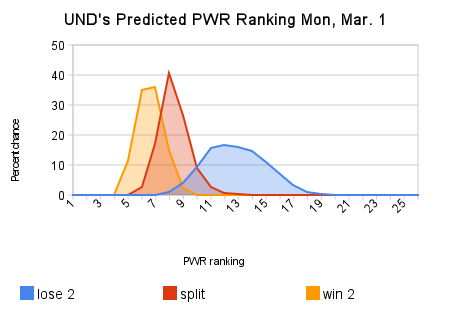
Weekend PWR forecast

Review of last week’s forecast

The Feb. 22 forecast predicted that with a sweep the Sioux would most likely be 7th or 8th (a 25-30% chance of each). The Sioux are currently #8 in PWR.

Look at next week

This is actually a pretty interesting chart. The split and sweep scenarios have very tall spikes, meaning there’s a pretty narrow range in which UND is likely to fall in those scenarios. If UND gets swept, however, the Sioux are just as likely to be #10 as #16 — it really depends what else happens around the league.

Games to watch

Here are the non-Sioux games that could have the most influence on UND’s PWR after this weekend. The very different shapes of the UND PWR curves this week might affect how you interpret this list — since there is much higher variance on the swept curve, games that most affect the Sioux if UND gets swept probably dominate this list.

AA over Alaska (sweep helps 1.6, split 1.16)
Princeton/Quinnipiac over Yale (sweep helps .99, one win .54)
Merrimack over Maine (sweep helps .79)
Northeastern over UNH (sweep helps .55)

Two week (end of regular season) forecast

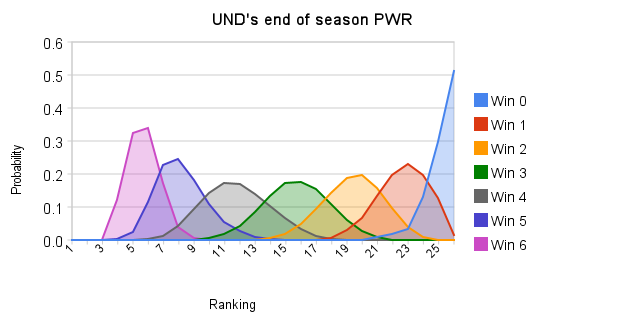
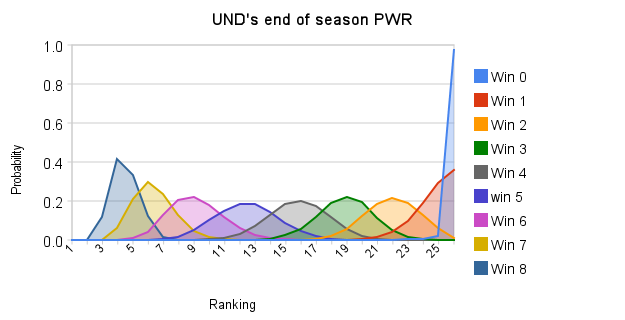
With only four games remaining in the regular season, this forecast demonstrates just how volatile PWR is. UND stands a modest chance (~5%) of finishing the regular season with a 1-seed PWR ranking (#3 or #4) with two sweeps. On the back side, getting swept out would almost certainly knock UND out of the field, with only a ~5% chance of finishing #16 or higher.

More likely scenarios lead to more middling outcomes, though winning 2 or more leaves UND quite likely to be in the tournament field as of the end of the regular season. Then, of course, the WCHA tournament should provide similar opportunity to rise or fall.

Final WCHA standings possibilities

Though these days we usually focus on the PairWise rankings, because they determine who makes the NCAA tournament, SiouxSports.com’s toolset was actually originally launched with a surprisingly complicated program that calculate the possible final WCHA standings.

As the Sioux are in the somewhat unusual position of fighting for home ice in the conference tournament and worried about making the NCAA tournament, it felt like time to dust it off. Here’s how the WCHA race looks as of today.

Team Current
Points
Conference
Series
Remaining
Possible
Final
Rankings
Denver 36 2 1st-4th
  • Has secured home ice in WCHA playoffs
  • Can clinch T-2nd with 1 point this weekend
  • Can clinch 2nd with 2 points this weekend
  • Can clinch T-1st with 3 points this weekend
  • Can clinch 1st with 4 points this weekend
SCSU 33 1 1st-T4th
  • Has secured home ice in WCHA playoffs
UW 31 2 1st-5th
  • Has secured home ice in WCHA playoffs
  • Can clinch T-4th with 2 points this weekend
  • Can clinch 4th with 3 points this weekend
  • Can no longer finish 1st with fewer than 2 points this weekend
  • Can no longer finish T-1st with fewer than 1 point this weekend
UMD 29 2 1st-7th
  • Can clinch 6th with 1 point this weekend
  • Can clinch 5th with 2 points this weekend
  • Can clinch T-4th with 4 points this weekend
  • Can no longer finish 1st with fewer than 4 points this weekend
  • Can no longer finish T-1st with fewer than 3 points this weekend
  • Can no longer finish 2nd with fewer than 1 point this weekend
UND 25 2 T-2nd-T7th
  • Can clinch 7th with 1 point this weekend
  • Can clinch T-6th with 4 points this weekend
  • Can no longer finish T-2nd with fewer than 4 points this weekend
  • Can no longer finish 3rd with fewer than 3 points this weekend
  • Can no longer finish T-3rd with fewer than 2 points this weekend
  • Can no longer finish 4th with fewer than 1 point this weekend
CC 25 2 T-2nd-T7th
  • Can clinch 7th with 1 point this weekend
  • Can clinch T-6th with 4 points this weekend
  • Can no longer finish T-2nd with fewer than 4 points this weekend
  • Can no longer finish 3rd with fewer than 3 points this weekend
  • Can no longer finish T-3rd with fewer than 2 points this weekend
  • Can no longer finish 4th with fewer than 1 point this weekend
UMN 22 2 4th-T8th
  • Can clinch 8th with 1 point this weekend
  • Can clinch T-7th with 3 points this weekend
  • Can clinch 7th with 4 points this weekend
  • Can no longer finish 4th with fewer than 4 points this weekend
  • Can no longer finish 5th with fewer than 2 points this weekend
  • Can no longer finish T-5th with fewer than 1 point this weekend
AA 18 1 T-7th-9th
  • Can no longer earn home ice in WCHA playoffs
Mankato 17 2 T-6th-9th
  • Can no longer earn home ice in WCHA playoffs
  • Can no longer finish T-6th with fewer than 4 points this weekend
  • Can no longer finish 7th with fewer than 2 points this weekend
  • Can no longer finish T-7th with fewer than 1 point this weekend
MTech 8 2 10th-10th
  • Can no longer earn home ice in WCHA playoffs

PWR forecast for Feb. 22

Look back at last week’s forecast

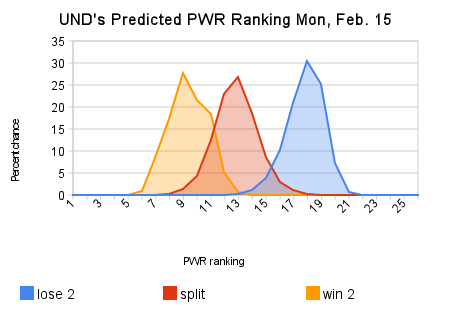
Looking back at the PWR forecast for Feb. 15, the Sioux split and landed right in the meaty part of the prediction for a split, a drop of 2 places to #13 in today’s PWR.

Prediction of UND’s PWR after this weekend

After the excitement of last week’s forecast, in which UND’s PWR was unnaturally high such that a split made a fall in ranking very likely, this week’s forecast is a bit more boring. In fact, it looks a lot like last week’s. From #13, UND is likely to rise a couple spots with a sweep, fall a couple spots getting swept, and stay about where they are if they split.

Games to watch

Minnesota over Colorado College (sweep helps UND 1.2)
Mass.-Lowell over Maine (sweep helps UND 1.1, single win helps .76)
Miami over Nebraska-Omaha (sweep helps UND .87)
Vermont over New Hampshire (sweep helps UND .84)
Merrimack over Massachusetts (sweep helps UND .78, single win helps .63)
St. Lawrence/Clarkson over Yale (sweep helps UND .78, single win helps .61)

Look ahead to end of regular season

UND remains in the driver’s seat. To finish the regular season in a tournament-likely position (e.g. #13 in PWR or better) would require winning 4 of the remaining 6.

PWR forecast for Feb. 15

Look back at last week’s forecast
Things went about as well for UND as possible during the bye week, with almost every game going as last week’s forecast predicted best for the Sioux.  That landed UND at #11 in the PairWise Rankings today.

Prediction of UND’s PWR after this weekend
If you think of UND as the near the top of its natural range, for how it’s done to date, most of the outcomes are downhill from here.  A climb is possible with a split, but only about a 5% chance.  A sweep would let UND climb in about 75% of possible outcomes (to as high as 6 or 7 in about 9% of scenarios in which UND sweeps).

Games to Watch

As usual, the ranges in which UND’s PWR could land are pretty broad, even for each fixed UND outcome.  Lots of non-UND games can have a pretty big effect on UND’s PWR.  These are the most important non-UND games of the week:

Merrimack over Vermont (win two +1.2, win one +.24)
Northeastern over Massachusetts (win two +1.2, win one +.60)
Boston Univ over Maine (win two +.84, win one +.35)
Lake Superior over Ferris St (win two +.74, win one +.42)
Mankato over Wisconsin (win two +.66, win one +.15)

While explaining why each of those is important is a bit beyond the scope of this post, PWR enthusiasts can study UND’s PWR Details to try to figure it out.

First look at end of season
With only 8 games remaining in the regular season, it’s a good time to take a first look beyond the upcoming weekend to see where UND could end the regular season in PWR.

A #1 seed is still possible, but will take a good streak from the Sioux. Remaining a TUC is almost a certainty, unless the Sioux really slump. To feel pretty confident about making the NCAA tournament requires winning 6 of the remaining 8 before going into the WCHA tournament. However, a good WCHA tournament showing or a little bit of luck, and the Sioux could make the NCAA tournament after winning as little as 3 of the next 8.

PWR forecast

Checked out the New PWR Details post and can’t make heads or tails of it?

No worries, for those who don’t want to dig into the numbers themselves, but just want to know what’s going to happen — I’ve got the PWR forecaster back up and running. A brief explanation of the technology is at the end of the article.

This is actually a very fun week to first post it, in that the Sioux don’t play. So, you’re getting to see the pure effects of other teams’ games on UND’s PairWise ranking.

Games to watch

Northern Michigan over Ferris St (sweep helps UND about 1.3, single win not much at all)
Alaska over Michigan St (sweep helps UND about 1.2, single win not much)
Wisconsin over Michigan (single win helps UND about 1.2)

Denver/CC over Mercyhurst/Air Force (UND is an average of 1.4 higher if Mercyhurst is swept, 1.5 higher if Air Force is swept, 2.1 lower if Denver is swept, .4 lower if CC is swept)

Looking at UND’s PWR details, a few of these are obvious. UND can take the comparison to Ferris by flipping RPI (even though TUC is about to come into play and currently favors Ferris). Similar story for Michigan St. UND already has the RPI comparison for Michigan so TUC or COP must be up for grabs.

CC/Denver are interesting and less immediately obvious — UND’s 0-7 deficit vs. Denver is insurmountable, so this one isn’t about the direct comparison between UND and Denver. So, there’s some secondary effect there (which interestingly correlates with the common theory of the importance of interconference records. :shrug: )

Brief explanation of the simulator

The PWR forecaster simulates the remainder of the season millions of times, with random outcomes for each game (the probability of each team winning a given game isn’t 50-50, but instead determined by their relative strength as measured by KRACH).

For each set of outcomes, the PairWise Ranking is recalculated and tallied. Those tallies are then used to determine probabilities for particular outcomes, e.g. in 1/5 of outcomes UND is ranked #10 in PWR and in 1/2 of outcomes UND is ranked #11 in PWR, and so forth.

New PWR details

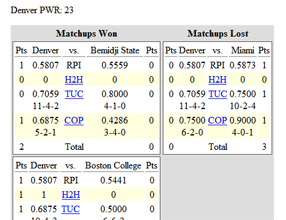
Most readers know they can find the current PairWise Rankings (which mimics the selection process the NCAA uses to seed the tournament) on SiouxSports.com’s PWR Rankings page. For those who have a deep knowledge of PWR and like to dig deeper to see the detailed data behind how it’s currently being calculated, SiouxSports.com has long offered the most thorough PWR details data on the web.

Having been an avid consumer of that data myself for many years, I’ve been working on presenting it in a way that makes it easier to inspect and analyze. Without further ado:

PWR Details for UND

The old way:

The way most people use this page is to try to figure out which comparisons for a given team are most likely to flip. I did that with the old page by scrolling through all the comparisons looking for those that were close, then diving into the details of those that were close to see if any of the criteria could flip.

I think that’s much easier with the new, one page grid. The comparisons are all in a single column on the left, color coded by how close they are. Then, scanning across a single row for all the comparison criteria for a team is similarly easy, again with color coding to indicate whether the comparison is won or lost and by how much.

The new way:

As in the old page, additional details are available for each H2H, TUC, and COP comparison by clicking on each underlined result. Those details include not only what games contribute to the current comparison, but also what future scheduled games will affect it.

PWR impact of Minnesota games vs Cornell games

A couple weeks ago in my post, First Look at PWR contributor — non-conference records, I suggested that it’s not clear that non-conference games have as profound an impact on PWR as conventional wisdom has grown to suggest.

It’s obviously fairly trivial to mentally construct a scenario in which a single non-conference game has a larger impact than other games because it’s one of very few games that contribute to the common opponents comparisons with quite a few other teams in the other conference. However, it’s not obvious how common and influential such situations are in real life.

Some Sioux fans, disappointed in last week’s outcome versus Minnesota, noted that next week really matters because it’s against a non-conference foe from a major conference. Without further ado, a comparison of the effect on UND’s PWR of the games vs. Minnesota and Cornell.

UND’s PWR after next weekend if…

Swept by Cornell* 16
Sweep Cornell* 8
Swept by Minnesota+ 14
Sweep Minnesota+ 5

* – Minnesota games recorded with actual results
+ – Cornell games included (to have same number of GP as Cornell comparison) assumed a split

All scenarios assume only the actual games played to date with the addition of two games between UND and Cornell. The actual PWR after next weekend may look quite different because dozens of other games will actually be played.

As of a PWR calculated today, the outcome of the Cornell games actually matters slightly less than the outcome of the Minnesota games, in the scenarios provided. It’s close enough that it’s easy to shift the outcome (e.g. omitting the split vs. Cornell pushes UND up to #4 with a sweep of Minnesota, etc…).

You can play around yourself using Whelan’s Build your own rankings calculator.

First look at PWR contributor — non-conference records

It’s a long held belief that in the eyes of PWR, some games are more valuable than others. In particular, record against non-conference opponents is often cited as critical (including in last year’s Swept at the GLI — how harmful to PWR? post in which I noted that the number of scenarios in which UND could finish oh, say, 8th, had fallen from 22% of all scenarios to 5% of all scenarios). That belief stems from the “common opponents” comparison, which for teams in different conferences can be dependent on just a few games that were played between teams in those two conferences.

In case you haven’t been paying attention, UND has a decent out-of-conference record this year, with 3/4 of the scheduled non-conference games already in the books. That got me wondering: 1) how UND’s interconference performance this year compared to past years, and 2) if there really were pronounced shifts in PWR based on any differences.

Without further ado…

UND’s out of conference record and final PWR
Season out of conference
record
overall record Final PWR
2009-10 (.833) 4-0-2
(2 to go)
(.636) 12-6-4
2008-09 (.556) 5-4-0 (.619) 24-14- 4 8
2007-08 (.786) 5-1-1 (.700) 26-10- 4 3
2006-07 (.750) 6-2-0 (.613) 22-13- 5 7
2005-06 (.750) 7-2-1 (.640) 27-15- 1 6
2004-05 (.750) 5-1-2 (.598) 22-14- 5 8
2003-04 (.833) 5-1-0 (.782) 29- 7- 3 1

That’s not quite what I expected. For example, comparing 08-09 to 06-07 — UND had pretty different out-of-conference records, pretty similar overall records, and pretty similar PWR rankings. That holds true eyeballing the (admittedly small) sample — UND’s PWR seems to roughly rise and fall with its overall record, with no obvious indication that the out-of-conference record is a strong contributor.  Again: that’s a very non-scientific glance and a very small sample, but it’s what I have.

Another dead end I traveled down was trying to extend that idea to if an entire conference’s interconference record noticeably influences how many of its teams made the NCAA tournament (this one started on even shakier ground, in that the conference would clearly be better off with its interconference wins all consolidated in one group of teams and losses in another, the distribution of which I omit from this eyeball analysis).  Hat tip to CollegeHockeyNews.com interconference records for the raw data.

Interconference record and teams in NCAA Tournament
season WCHA vs
‘Big 4’
WCHA teams
in NCAA
tourney
2009-10 .585
2008-09 .536 3
2007-08 .589 6
2006-07 .645 3
2005-06 .576 4
2004-05 .654 5
2003-04 .676 5

Once again, if there’s anything there, it’s not particularly obvious.

In that “Swept at the GLI” article referenced above, I went in with the assumption that losing to out-of-conference opponents was a really big deal and let the data confirm that prior.  However, as we saw through the rest of the Spring (e.g. PWR Forecast Feb. 19, vs Denver), in-conference games later in the season often had similar, if not greater, impacts.

Bottom line? Logically, wins against other conferences clearly matter a lot; it’s easy to construct scenarios where flipping a single win to a loss (or vice versa) pushes a team up or down a few slots in the PWR. However, there’s no particular evidence that a team’s or conference’s fortunes rise and fall with interconference results to quite the extent a lot of us assume.

Bonus – for sticking around and proving you really like PWR, here’s a preview of my new Team PWR details page (that will eventually replace these). Much easier to scan and see which could flip based on which criterion.

When to start looking at PWR?

Earlier this year, USCHO raised eyebrows among college hockey geeks by beginning to publish bracketology articles on Nov.10.  USCHO justified expending the effort to predict what the tournament would look like had the season ended after just three weeks by claiming it was a natural response to other sites (no names named 😉 ) making PairWise Rankings available before USCHO’s typical January date.  While some may quibble that seeding a bracket is a different activity from letting an automatically calculated rankings table be published, I became most interested in the question, “when is the appropriate time to begin looking at PWR?”

The real answer is, obviously, whenever you’re interested in it.

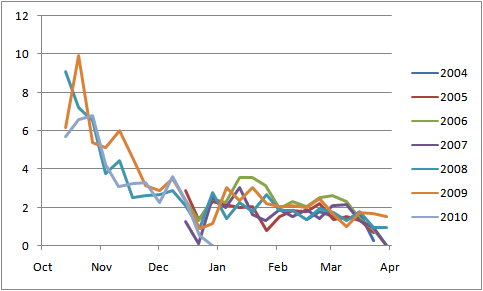
My primary interest in looking at rankings is to see how each team is doing — who is good, who isn’t, who is likely to make the tournament?  The value of the rankings for that purpose is dependent on their stability.  A team ranked #1 in an accurate ranking should probably be able to lose a game and still be ranked in the top few teams.  So, my first tactic for determining the quality of the PWR rankings was to determine how much ranked teams move within the rankings from week-to-week.

Average deviation of all teams' weekly PWR rankings from previous week's rankings

Before December the PWR rankings have wild swings, though settle into an average move of 2-3 slots in January and under 2 slots by March (the low movement in late December is the holiday break in which teams play fewer games).

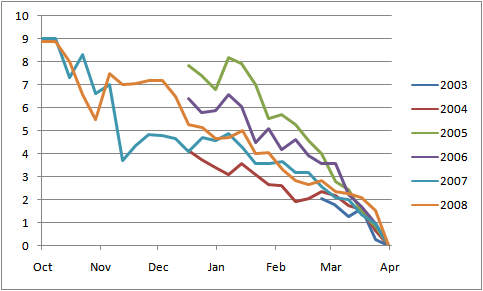
That’s interesting, but the actual pairwise comparisons are only meaningfully performed once, after the conference tournaments.  So, the reason we really look at the PWR earlier is to get an idea of who might make the tournament.  Therefore, to determine the quality of an individual week’s PWR we’re actually most interested in how well it predicts the final PWR.

Average deviation of all teams' weekly PWR rankings from end of year rankings

Though PWR in January seemed somewhat stable, in that teams only move a couple of slots each week, as those movements add up it actually proves a pretty poor predictor of the final PWR.  Each team has been ranked an average of 3-8 slots differently on April 1 than in January over the past six years.  Even the March 1 PWR rankings have deviated from the April 1 rankings by an average of 2-4 slots.

So, enjoy looking at the weekly PWR tables, but remember that they’re all for fun.

A couple notes:

  • April 1 isn’t quite the final PWR because some NCAA tournament games have been played by that date.
  • The average movement in each of the above charts is mean movement of those teams that had PWR rankings in: 1) both weeks, and 2) the week in question and on April 1.  No attempt was made to determine variance, or whether that mean was overly influenced by a few large moves.

References/links of interest: