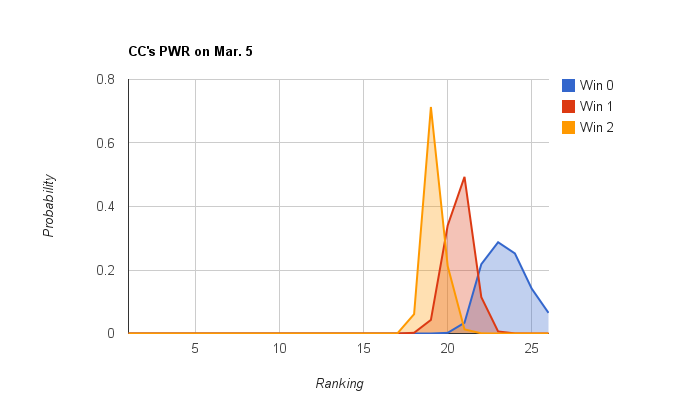
Assuming all game outcomes are equally likely, Northern Michigan stands something like a 15% chance of making that tournament.
From my previous PWR possibilities article, Northern Michigan’s overall possible final PWR rankings:
Possible PWR outcomes for NMU
| PWR |
Number of
scenarios |
Percent of
scenarios |
| 13 |
15297 |
1.3% |
| 14 |
120251 |
10.2% |
| 15 |
388264 |
32.9% |
| 16 |
610668 |
51.8% |
| 17 |
45168 |
3.8% |
Because 13-16 are all on the bubble, it’s most important for Northern Michigan that a limited number of conferences are won by teams that won’t be in the top 16.
Again, those are:
WCHA (2/6)
Michigan Tech
St. Cloud St
Hockey East (1/4)
Providence
ECAC (2/4)
Harvard
Colgate
CCHA (1/4)
Bowling Green
Atlantic Hockey (4/4)
RIT
Niagara
Mercyhurst
Air Force
So, while every conference could conceivably be won by a team not in the top 16, only Atlantic Hockey is guaranteed to be so. So, the last at-large team will be somewhere between PWR 11 and 15. If 3 conferences are won by non-top 16, #13 in the PWR will be in. If 2 conferences are won by non-top 16, #14 PWR will be in. If only AHA is won by a non-top 16, #15 PWR will be in.
Odds of NMU advancing, based on final PWR rank
| PWR |
Odds of NMU
having rank |
Odds of
rank advancing |
Odds of
rank or
better advancing |
Odds of
NMU advancing
via this scenario |
| 15 |
32.90% |
18.75% |
18.8% |
6.169% |
| 14 |
10.20% |
40.63% |
59.4% |
6.056% |
| 13 |
1.30% |
30.21% |
89.6% |
1.165% |
| 12 |
|
9.4% |
99.0% |
|
| 11 |
|
1.0% |
100.0% |
|
| Total odds of NMU advancing |
13.39% |
Note that the odds of each rank advancing assume that each team has an equal shot at winning each game; in other words, they’re actually the share of outcomes in which each rank advances. That table also naively assumes the outcomes that determine NMU’s final PWR are completely independent from the outcomes that determine which PWR ranks advance. That is, of course, not true. But, because none of the scenarios (described below) require unranked teams to advance, it’s a fine rough estimate.
What influences NMU’s final PWR
Because NMU doesn’t have any games remaining, the Wildcats are the mercy of others.
Looking at NMU’s PWR Details, there are two very obvious comparisons that NMU is currently losing but could take (because the comparison is close enough and the other team is still playing):
It’s also apparently helpful for RIT to defeat Air Force. It’s not immediately obviously why this is the case (both are TUCs over whom NMU is winning the comparison, but so are all the other teams NMU is trying to gain on), but the models say NMU finishes noticeably higher in those scenarios.
A deeper dive into the scenarios
Miami defeating Western Michigan is huge for NMU. Note that it would eliminate a huge number of the #16-17 scenarios, while preserving all of the #13 scenarios and most of the #14 scenarios.
PWR outcomes for NMU if Miami defeats Western Michigan
| PWR |
Number of
scenarios |
Percent of
scenarios |
| 13 |
15297 |
2.6% |
| 14 |
102442 |
17.4% |
| 15 |
246385 |
41.8% |
| 16 |
200993 |
34.1% |
| 17 |
24707 |
4.2% |
Western Michigan losing a second game is also pretty helpful. It drops a big majority of the #16-#17 outcomes and about half of the #15. This isn’t completely necessary, in that about 1/3 of the #13 outcomes and about 40% of the #14 outcomes exist outside this scenario, but this is a very attractive scenario for NMU.
PWR outcomes for NMU if Western Michigan also loses the consolation game
| |
To Michigan |
|
To Bowling Green |
| PWR |
Number of
scenarios |
Percent of
scenarios |
|
Number of
scenarios |
Percent of
scenarios |
| 13 |
4992 |
5.1% |
|
4992 |
5.1% |
| 14 |
30630 |
31.2% |
|
30685 |
31.2% |
| 15 |
61242 |
62.3% |
|
61153 |
62.2% |
| 16 |
1440 |
1.5% |
|
1474 |
1.5% |
Harvard defeating Cornell looks useful for NMU. It eliminates a lot of the 15-17 scenarios while leaving most of the 13-14 scenarios in tact.
PWR outcomes for NMU if Harvard defeats Cornell
| PWR |
Number of
scenarios |
Percent of
scenarios |
| 13 |
15297 |
2.6% |
| 14 |
75380 |
12.8% |
| 15 |
221000 |
37.5% |
| 16 |
257768 |
43.7% |
| 17 |
20379 |
3.5% |
However, what’s not obvious from that table is that almost all the good scenarios come about when Cornell loses a 2nd game and almost all the bad scenarios come about when Cornell wins the 2nd game (after losing the 1st).
PWR outcomes for NMU if Cornell also loses the consolation game
| |
To Union |
|
To Colgate |
| PWR |
Number of
scenarios |
Percent of
scenarios |
|
Number of
scenarios |
Percent of
scenarios |
| 13 |
12993 |
13.2% |
|
2304 |
2.3% |
| 14 |
30915 |
31.4% |
|
29014 |
29.5% |
| 15 |
48434 |
49.3% |
|
66923 |
68.1% |
| 16 |
5959 |
6.1% |
|
63 |
0.1% |
| 17 |
3 |
0.0% |
|
|
|
Note that I haven’t said anything about the RIT/Air Force outcome mentioned above. While it does indeed shift NMU’s chances of a 13-14 up quite a bit, about 2/3 of the #13 scenarios and 3/4 of the #14 scenarios exist outside of this outcome.
PWR outcomes for NMU if RIT defeats Niagara, Air Force defeats Mercyhurst, and RIT defeats Air Force
| PWR |
Number of
scenarios |
Percent of
scenarios |
| 13 |
4942 |
3.4% |
| 14 |
30972 |
21.0% |
| 15 |
54783 |
37.2% |
| 16 |
53420 |
36.2% |
| 17 |
3339 |
2.3% |
So, Air Force defeating RIT is a nice outcome for NMU, but by no means necessary.
Too long, didn’t read
Bottom line? NMU’s best shot is for Cornell to lose twice and Western Michigan to lose at least once (though twice is a little better). That scenario includes all of the #13 possibilities, about 1/3 of the #14 possibilities, about 1/5 of the #15 possibilities, and a miniscule chance of being #16.
