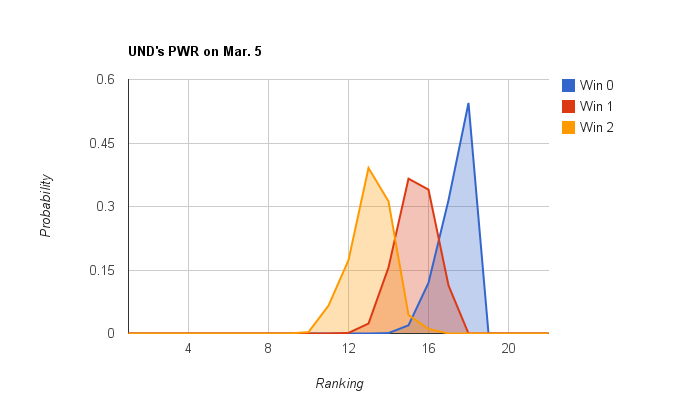
UND continues to keep things interesting by doing just what it needs to do to keep its playoff hopes alive, but no more. A split last weekend left UND at #14 in the PairWise Rankings (PWR) and a good shot at making the NCAA tournament. The Sioux need a sweep this weekend to hold steady or rise slightly, anything less is likely to lead to a fall.
The PWR has played out pretty much as expected this Spring. If you look back at A first look at the PairWise Rankings and UND’s tournament possibilities from January 3, I forecast that the Sioux would need to win 11 of 15 to be confidently above #13 at the end of the regular season. Since then, the Sioux are 8-4-1 with 2 games remaining in the regular season, and this week’s forecast confirms that 2 more wins are needed to stand a good shot of finishing ranked #13 or above.
| Win 0 | Win 1 | Win 2 | |
| 1 | 0.00% | 0.00% | 0.00% |
| 2 | 0.00% | 0.00% | 0.00% |
| 3 | 0.00% | 0.00% | 0.00% |
| 4 | 0.00% | 0.00% | 0.00% |
| 5 | 0.00% | 0.00% | 0.00% |
| 6 | 0.00% | 0.00% | 0.00% |
| 7 | 0.00% | 0.00% | 0.00% |
| 8 | 0.00% | 0.00% | 0.00% |
| 9 | 0.00% | 0.00% | 0.01% |
| 10 | 0.00% | 0.00% | 0.33% |
| 11 | 0.00% | 0.00% | 6.92% |
| 12 | 0.00% | 0.14% | 24.24% |
| 13 | 0.00% | 2.49% | 63.34% |
| 14 | 0.10% | 18.08% | 94.57% |
| 15 | 2.03% | 54.65% | 98.93% |
| 16 | 14.01% | 88.64% | 100.00% |
| 17 | 45.51% | 100.00% | 100.00% |
| 18 | 99.97% | 100.00% | 100.00% |
| 19 | 100.00% | 100.00% | 100.00% |
| 20 | 100.00% | 100.00% | 100.00% |
The good news is that even with a split this weekend UND fans won’t have to abandon all hope. A split would leave UND with a better than 50% chance of being #15 or above and an 89% chance of being #16 or above. A good conference tournament could certainly push UND into NCAA tournament position from there.
Who to cheer for this weekend
Other than UND’s own matchup, these are the games that most improve UND’s outcomes.
If UND sweeps:
- New Hampshire over Maine
- Nebraska-Omaha over Denver (sweep)
- Bowling Green over N. Michigan (at least one)
If UND splits:
- Notre Dame over Ohio St (at least one)
- Massachusetts over Merrimack (sweep)
- Bowling Green over N. Michigan (sweep)
If UND is swept:
- Massachusetts over Merrimack (sweep)
I may relabel these in future posts, because they’re clearly split into offensive (comparisons UND is losing but can flip) and defensive (comparisons UND is winning but could lose). The offensive moves are those that help us most if we win — the Sioux could take the comparisons with Maine, Denver, and Northern Michigan if we win and they lose. The defensive moves are those that help us most if we lose — the Sioux want to hold onto the comparisons with Ohio St. and Merrimack by them losing.
A look around the WCHA
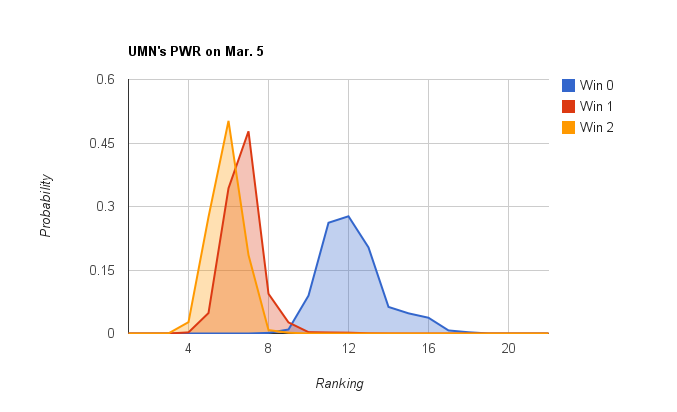
Minnesota, while not quite locked up, is sure in control of it’s own destiny.
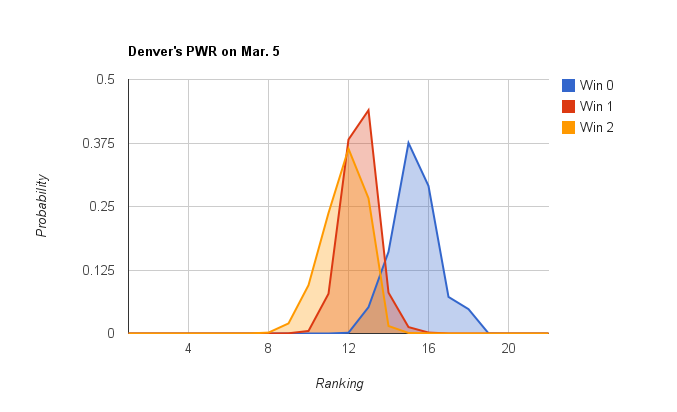
Denver’s split also resulted in a chart that looks a lot like last week’s, but with the win 0 and win 4 chopped off, due to the split.
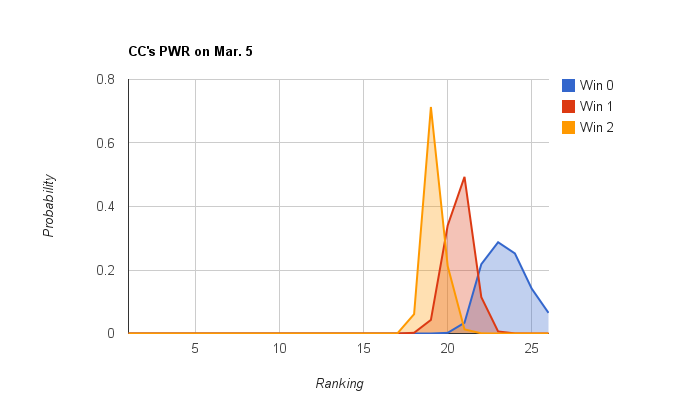
And unfortunately for CC, getting swept leaves their chart looking a lot like last week’s, but with the win 3 and win 4 chopped off. The Tigers hopes aren’t dead yet, but they’re fading fast.
A look around the NCAA
Finally, this one is big, here are the likelihoods of each each NCAA team having each PWR ranking after this weekend.
| Team | Mar. 5 PWR Possibilities | ||
|---|---|---|---|
| Overall | Win none | Win all | |
| Boston College | 1 24.4% 2 60.1% 3 8.9% 4 4.8% 5 1.7% 6 0.1% 7 0.0% 8 0.0% |
1 0.5% 2 1.7% 3 15.4% 4 44.6% 5 34.8% 6 2.8% 7 0.2% 8 0.1% |
1 25.5% 2 65.1% 3 7.4% 4 1.8% 5 0.2% 6 0.0% |
| Michigan | 1 4.3% 2 22.2% 3 70.1% 4 3.3% 5 0.2% 6 0.0% |
n/a | n/a |
| Ferris State | 1 0.2% 2 2.2% 3 10.8% 4 51.8% 5 30.4% 6 4.6% 7 0.0% |
n/a | n/a |
| UMD | 1 71.0% 2 14.0% 3 2.8% 4 2.1% 5 2.6% 6 3.2% 7 3.1% 8 0.9% 9 0.3% 10 0.1% 11 0.0% |
1 0.0% 2 0.1% 3 0.4% 4 3.3% 5 14.8% 6 31.6% 7 35.1% 8 10.0% 9 3.6% 10 0.8% 11 0.2% |
1 93.0% 2 6.9% 3 0.0% |
| Boston University | 1 0.2% 2 1.4% 3 5.6% 4 23.2% 5 34.0% 6 19.1% 7 6.5% 8 0.6% 9 1.4% 10 2.4% 11 3.1% 12 2.4% 13 0.1% 14 0.0% |
5 0.0% 6 0.3% 7 2.4% 8 5.9% 9 13.2% 10 23.6% 11 30.1% 12 23.8% 13 0.7% 14 0.0% |
1 0.5% 2 3.0% 3 12.1% 4 47.0% 5 37.3% 6 0.1% 7 0.0% |
| Miami | 3 0.0% 4 0.0% 5 1.2% 6 8.3% 7 21.4% 8 30.4% 9 29.8% 10 8.8% 11 0.0% 12 0.0% |
n/a | n/a |
| Michigan State | 5 0.0% 6 0.1% 7 1.0% 8 5.9% 9 23.0% 10 35.9% 11 23.3% 12 10.4% 13 0.5% 14 0.0% |
n/a | n/a |
| UMN | 2 0.0% 3 0.0% 4 1.3% 5 14.2% 6 37.4% 7 29.5% 8 4.6% 9 1.3% 10 1.2% 11 3.1% 12 3.3% 13 2.4% 14 0.7% 15 0.5% 16 0.4% 17 0.1% 18 0.0% 19 0.0% |
7 0.0% 8 0.2% 9 0.9% 10 8.8% 11 26.0% 12 27.7% 13 20.6% 14 6.2% 15 4.8% 16 3.8% 17 0.7% 18 0.3% 19 0.0% |
2 0.0% 3 0.0% 4 2.7% 5 27.4% 6 50.3% 7 18.5% 8 0.8% 9 0.2% 10 0.0% 11 0.0% |
| Mass.-Lowell | 2 0.1% 3 1.8% 4 13.6% 5 15.5% 6 23.9% 7 18.1% 8 8.0% 9 5.7% 10 2.9% 11 4.0% 12 2.4% 13 1.7% 14 1.1% 15 0.8% 16 0.4% 17 0.1% 18 0.0% 19 0.0% |
6 0.0% 7 0.0% 8 0.4% 9 2.6% 10 9.7% 11 16.2% 12 21.3% 13 20.0% 14 12.7% 15 9.8% 16 5.2% 17 1.7% 18 0.2% 19 0.0% |
2 0.1% 3 3.5% 4 26.8% 5 27.9% 6 29.7% 7 11.7% 8 0.3% |
| Northern Michigan | 5 0.0% 6 0.0% 7 0.1% 8 1.2% 9 5.7% 10 15.5% 11 26.4% 12 17.0% 13 9.8% 14 7.7% 15 3.9% 16 4.1% 17 3.6% 18 4.8% 19 0.2% 20 0.0% |
13 0.0% 14 0.0% 15 0.4% 16 6.0% 17 26.5% 18 64.0% 19 2.8% 20 0.2% |
5 0.0% 6 0.0% 7 0.2% 8 1.4% 9 6.5% 10 17.7% 11 30.2% 12 19.4% 13 11.2% 14 8.7% 15 3.2% 16 1.5% 17 0.0% |
| Maine | 5 0.0% 6 0.0% 7 0.3% 8 1.6% 9 8.2% 10 22.8% 11 21.0% 12 14.4% 13 9.3% 14 9.8% 15 5.8% 16 5.3% 17 1.2% 18 0.4% 19 0.0% |
8 0.0% 9 0.1% 10 0.6% 11 2.1% 12 11.3% 13 21.1% 14 28.0% 15 16.8% 16 15.4% 17 3.5% 18 1.1% 19 0.0% |
5 0.0% 6 0.0% 7 0.5% 8 2.5% 9 12.4% 10 34.4% 11 30.8% 12 16.1% 13 3.0% 14 0.2% 15 0.0% |
| UND | 9 0.0% 10 0.2% 11 3.8% 12 10.2% 13 23.7% 14 23.9% 15 15.8% 16 13.5% 17 5.9% 18 3.0% 19 0.0% |
14 0.1% 15 1.9% 16 12.1% 17 31.4% 18 54.5% 19 0.0% |
9 0.0% 10 0.3% 11 6.5% 12 17.3% 13 39.2% 14 31.2% 15 4.4% 16 1.1% |
| Western Michigan | 13 0.0% 14 0.3% 15 4.1% 16 27.6% 17 48.7% 18 19.3% 19 0.1% |
n/a | n/a |
| Denver | 6 0.0% 7 0.0% 8 0.1% 9 0.8% 10 4.3% 11 13.6% 12 32.8% 13 31.8% 14 6.2% 15 5.3% 16 3.7% 17 0.9% 18 0.6% 19 0.0% 20 0.0% |
11 0.0% 12 0.2% 13 5.2% 14 16.1% 15 37.7% 16 29.0% 17 7.2% 18 4.7% 19 0.0% 20 0.0% |
6 0.0% 7 0.0% 8 0.2% 9 1.9% 10 9.6% 11 23.8% 12 36.3% 13 26.5% 14 1.5% 15 0.1% 16 0.0% |
| Merrimack | 9 0.0% 10 0.1% 11 1.1% 12 3.8% 13 5.9% 14 10.7% 15 13.8% 16 20.5% 17 13.8% 18 23.5% 19 2.6% 20 1.9% 21 1.6% 22 0.5% 23 0.0% 24 0.0% 25 0.0% |
15 0.0% 16 0.0% 17 1.6% 18 57.8% 19 10.3% 20 13.7% 21 12.4% 22 3.8% 23 0.3% 24 0.0% 25 0.0% |
9 0.0% 10 0.2% 11 2.8% 12 9.2% 13 13.3% 14 20.7% 15 18.3% 16 12.7% 17 10.2% 18 11.2% 19 1.4% 20 0.0% |
| Notre Dame | 11 0.0% 12 0.0% 13 0.1% 14 1.0% 15 3.0% 16 6.2% 17 14.9% 18 27.1% 19 11.7% 20 20.1% 21 11.0% 22 4.0% 23 0.9% 24 0.0% |
17 0.0% 18 1.8% 19 16.0% 20 37.6% 21 27.7% 22 13.4% 23 3.4% 24 0.1% |
11 0.0% 12 0.0% 13 0.3% 14 2.0% 15 5.9% 16 12.3% 17 29.3% 18 50.0% 19 0.1% 20 0.0% |
| Ohio State | 10 0.0% 11 0.0% 12 0.2% 13 0.8% 14 3.8% 15 7.5% 16 10.5% 17 10.6% 18 17.2% 19 25.9% 20 17.7% 21 4.6% 22 1.3% 23 0.0% 24 0.0% |
18 1.2% 19 39.3% 20 40.1% 21 14.5% 22 4.8% 23 0.2% 24 0.0% |
10 0.0% 11 0.0% 12 0.4% 13 1.6% 14 7.6% 15 15.1% 16 21.1% 17 21.5% 18 32.4% 19 0.2% 20 0.0% |
| Union | 3 0.0% 4 0.0% 5 0.2% 6 3.3% 7 20.0% 8 46.7% 9 23.8% 10 5.8% 11 0.2% 12 0.0% |
n/a | n/a |
| Lake Superior | 17 0.0% 18 1.4% 19 29.4% 20 23.4% 21 15.0% 22 10.5% 23 8.6% 24 6.1% 25 3.5% 26 1.7% 27 0.4% 28 0.0% 29 0.0% |
20 0.3% 21 4.0% 22 13.2% 23 24.7% 24 28.0% 25 18.1% 26 9.4% 27 2.1% 28 0.1% 29 0.0% |
17 0.0% 18 2.2% 19 45.9% 20 33.6% 21 13.8% 22 4.4% 23 0.1% 24 0.0% |
| CC | 18 2.2% 19 25.8% 20 23.7% 21 25.1% 22 9.5% 23 5.5% 24 4.5% 25 2.5% 26 0.9% 27 0.2% 28 0.0% 29 0.0% 30 0.0% |
20 0.2% 21 3.3% 22 21.9% 23 28.9% 24 25.1% 25 14.1% 26 5.1% 27 1.2% 28 0.1% 29 0.0% 30 0.0% |
18 6.2% 19 71.4% 20 21.1% 21 1.3% 22 0.1% |
| Cornell | 9 0.0% 10 0.0% 11 0.4% 12 3.2% 13 14.0% 14 34.9% 15 39.6% 16 7.8% 17 0.1% |
n/a | n/a |
| UW | 16 0.0% 17 0.0% 18 0.2% 19 2.7% 20 6.2% 21 13.6% 22 11.1% 23 6.3% 24 6.5% 25 7.4% 26 6.2% 27 7.4% 28 10.6% 29 11.1% 30 7.4% 31 2.7% 32 0.6% 33 0.1% 34 0.0% |
24 0.1% 25 3.3% 26 8.0% 27 15.2% 28 23.7% 29 25.2% 30 16.8% 31 6.2% 32 1.3% 33 0.2% 34 0.0% |
16 0.0% 17 0.1% 18 1.7% 19 23.2% 20 37.9% 21 27.4% 22 7.7% 23 1.4% 24 0.3% 25 0.1% 26 0.0% 27 0.0% |
| Northeastern | 18 0.0% 19 0.0% 20 0.2% 21 1.0% 22 1.8% 23 2.2% 24 3.7% 25 8.7% 26 13.1% 27 12.1% 28 7.6% 29 3.1% 30 1.3% 31 1.1% 32 0.7% 33 0.3% 34 0.0% 35 0.0% Non-TUC 42.9% |
26 0.0% 27 0.0% 28 0.2% 29 0.6% 30 1.6% 31 2.3% 32 1.6% 33 0.6% 34 0.1% 35 0.0% Non-TUC 93.0% |
18 0.0% 19 0.1% 20 1.9% 21 10.2% 22 17.7% 23 21.8% 24 24.6% 25 16.0% 26 6.6% 27 1.1% 28 0.1% 29 0.0% |
| SCSU | 17 0.0% 18 0.3% 19 0.9% 20 1.9% 21 2.6% 22 3.3% 23 2.5% 24 4.5% 25 7.7% 26 11.6% 27 9.6% 28 4.9% 29 1.5% 30 1.1% 31 0.6% 32 0.4% 33 0.1% 34 0.0% 35 0.0% Non-TUC 46.5% |
23 0.0% 24 0.0% 25 0.1% 26 0.2% 27 0.4% 28 0.7% 29 1.0% 30 1.7% 31 1.2% 32 0.8% 33 0.2% 34 0.0% 35 0.0% Non-TUC 93.5% |
17 0.5% 18 3.6% 19 10.7% 20 21.6% 21 28.6% 22 28.4% 23 6.0% 24 0.7% 25 0.0% |
| Bemidji State | 22 0.0% 23 0.1% 24 2.0% 25 9.3% 26 19.1% 27 14.0% 28 9.1% 29 12.0% 30 13.3% 31 7.5% 32 2.7% 33 0.7% 34 0.1% 35 0.0% Non-TUC 10.1% |
Non-TUC 100.0% | 22 0.0% 23 0.1% 24 4.3% 25 19.8% 26 40.4% 27 27.0% 28 6.8% 29 1.5% 30 0.1% 31 0.0% |
| New Hampshire | 22 0.0% 23 0.0% 24 0.9% 25 4.6% 26 9.0% 27 10.3% 28 7.7% 29 8.5% 30 13.9% 31 14.2% 32 7.9% 33 1.8% 34 0.2% 35 0.0% Non-TUC 21.0% |
25 0.0% 26 0.0% 27 0.2% 28 2.1% 29 9.3% 30 20.0% 31 21.4% 32 12.0% 33 2.8% 34 0.2% 35 0.0% Non-TUC 32.0% |
22 0.0% 23 0.1% 24 2.7% 25 13.4% 26 26.2% 27 29.7% 28 18.2% 29 6.9% 30 2.4% 31 0.4% 32 0.0% 33 0.0% |
| Alaska | 25 0.0% 26 0.0% 27 0.1% 28 0.7% 29 2.2% 30 4.1% 31 4.7% 32 3.4% 33 1.4% 34 0.3% 35 0.0% 36 0.0% Non-TUC 83.1% |
Non-TUC 100.0% | 25 0.0% 26 0.0% 27 0.2% 28 1.8% 29 6.0% 30 11.1% 31 12.8% 32 9.1% 33 3.8% 34 0.8% 35 0.1% 36 0.0% Non-TUC 54.3% |
| Nebraska-Omaha | 20 0.0% 21 0.4% 22 2.6% 23 4.6% 24 3.1% 25 1.3% 26 1.0% 27 6.3% 28 15.7% 29 16.2% 30 5.8% 31 0.8% 32 0.0% Non-TUC 42.2% |
Non-TUC 100.0% | 20 0.1% 21 2.9% 22 21.5% 23 37.7% 24 25.2% 25 10.3% 26 1.9% 27 0.3% 28 0.0% |
| Massachusetts | 21 0.0% 22 0.3% 23 1.1% 24 3.0% 25 4.0% 26 2.7% 27 2.5% 28 5.8% 29 12.4% 30 13.8% 31 9.5% 32 3.2% 33 0.6% 34 0.1% 35 0.0% Non-TUC 41.0% |
Non-TUC 100.0% | 21 0.1% 22 2.3% 23 8.6% 24 23.3% 25 30.9% 26 21.2% 27 10.7% 28 2.6% 29 0.4% 30 0.0% 31 0.0% |
| MTech | 23 0.0% 24 0.3% 25 1.0% 26 2.3% 27 3.9% 28 4.1% 29 3.1% 30 2.0% 31 0.9% 32 0.2% 33 0.0% Non-TUC 82.1% |
Non-TUC 100.0% | 23 0.1% 24 1.6% 25 5.8% 26 12.7% 27 22.0% 28 22.7% 29 17.3% 30 11.4% 31 5.1% 32 1.2% 33 0.0% |
| Harvard | 18 0.0% 19 0.4% 20 3.5% 21 17.9% 22 32.0% 23 24.7% 24 16.9% 25 3.4% 26 1.0% 27 0.1% 28 0.0% |
n/a | n/a |
| Providence | 25 0.0% 26 0.1% 27 0.4% 28 1.2% 29 2.0% 30 2.3% 31 1.6% 32 0.7% 33 0.1% 34 0.0% 35 0.0% Non-TUC 91.7% |
Non-TUC 100.0% | 25 0.1% 26 0.7% 27 4.7% 28 14.4% 29 23.7% 30 27.6% 31 19.1% 32 8.0% 33 1.6% 34 0.2% 35 0.0% |
| Quinnipiac | 18 0.0% 19 0.3% 20 1.4% 21 6.6% 22 16.4% 23 21.2% 24 20.0% 25 13.9% 26 6.4% 27 4.2% 28 3.7% 29 3.0% 30 1.9% 31 0.8% 32 0.2% 33 0.0% 34 0.0% |
24 0.1% 25 1.1% 26 5.8% 27 14.4% 28 22.9% 29 24.1% 30 19.4% 31 9.6% 32 2.3% 33 0.3% 34 0.0% |
18 0.0% 19 0.3% 20 1.8% 21 8.1% 22 20.1% 23 25.9% 24 24.0% 25 15.2% 26 4.1% 27 0.4% 28 0.0% 29 0.0% |
| Colgate | 20 0.0% 21 0.5% 22 6.6% 23 22.1% 24 27.9% 25 29.2% 26 11.3% 27 2.1% 28 0.2% 29 0.0% 30 0.0% |
n/a | n/a |
| Bowling Green | Non-TUC 100.0% | Non-TUC 100.0% | Non-TUC 100.0% |
| St. Lawrence | Non-TUC 100.0% | Non-TUC 100.0% | Non-TUC 100.0% |
| Yale | 26 0.0% 27 0.1% 28 0.6% 29 2.0% 30 5.0% 31 7.7% 32 6.9% 33 3.6% 34 1.0% 35 0.1% 36 0.0% Non-TUC 73.1% |
Non-TUC 100.0% | 26 0.0% 27 0.1% 28 0.9% 29 3.2% 30 8.0% 31 12.3% 32 11.0% 33 5.8% 34 1.5% 35 0.2% 36 0.0% Non-TUC 57.0% |
| Mankato | Non-TUC 100.0% | Non-TUC 100.0% | Non-TUC 100.0% |
| Clarkson | Non-TUC 100.0% | Non-TUC 100.0% | Non-TUC 100.0% |
| AA | Non-TUC 100.0% | Non-TUC 100.0% | Non-TUC 100.0% |
| Air Force | 23 0.0% 24 0.4% 25 3.4% 26 13.6% 27 26.3% 28 27.4% 29 17.3% 30 8.3% 31 2.8% 32 0.4% 33 0.0% |
n/a | n/a |
| RIT | 27 0.0% 28 0.0% 29 0.1% 30 0.3% 31 0.3% 32 0.2% 33 0.1% 34 0.0% 35 0.0% Non-TUC 98.9% |
n/a | n/a |
| Niagara | Non-TUC 100.0% | n/a | n/a |
| Dartmouth | Non-TUC 100.0% | Non-TUC 100.0% | Non-TUC 100.0% |
| Princeton | Non-TUC 100.0% | Non-TUC 100.0% | Non-TUC 100.0% |
| Mercyhurst | Non-TUC 100.0% | n/a | n/a |
| Robert Morris | Non-TUC 100.0% | Non-TUC 100.0% | Non-TUC 100.0% |
| Holy Cross | Non-TUC 100.0% | Non-TUC 100.0% | Non-TUC 100.0% |
| Rensselaer | Non-TUC 100.0% | Non-TUC 100.0% | Non-TUC 100.0% |
| Vermont | Non-TUC 100.0% | Non-TUC 100.0% | Non-TUC 100.0% |
| Brown | Non-TUC 100.0% | Non-TUC 100.0% | Non-TUC 100.0% |
| Bentley | Non-TUC 100.0% | Non-TUC 100.0% | Non-TUC 100.0% |
| Connecticut | Non-TUC 100.0% | Non-TUC 100.0% | Non-TUC 100.0% |
| Canisius | Non-TUC 100.0% | Non-TUC 100.0% | Non-TUC 100.0% |
| Alabama-Huntsville | Non-TUC 100.0% | n/a | n/a |
| American Int’l | Non-TUC 100.0% | Non-TUC 100.0% | Non-TUC 100.0% |
| Army | Non-TUC 100.0% | Non-TUC 100.0% | Non-TUC 100.0% |
| Sacred Heart | Non-TUC 100.0% | Non-TUC 100.0% | Non-TUC 100.0% |
Three conferences (the AHA, CCHA, and ECAC) are already in their conference playoffs this week playing best-of-three series. For those teams the “win all” column includes all the scenarios in which that team wins two games, combining scenarios in which they go 2-0 with those in which they go 2-1.
Methodology
Each forecast is based on at least one million monte carlo simulations of the games in the described period. For each simulation, the PairWise Ranking (PWR) is calculated and the results tallied. The probabilities presented in the forecasts are the share of simulations in which a particular outcome occurred.
The outcome of each game in each simulation is determined by random draw, with the probability of victory for each team set by their relative KRACH ratings. So, if the simulation set included a contest between team A with KRACH 300 and team B with KRACH 100, team A will win the game in very close to 75% of the simulations.
Resources
- Current PWR Rankings (SiouxSports.com)
- CHN PWR Rankings (CollegeHockeyNews.com)
- TBRW build your own rankings (slack.net)
- Explanation of how PWR mimics NCAA tournament selection (CollegeHockeyNews.com)
- A first look at the PairWise Rankings and UND’s tournament possibilities
- Change to COP calculation in PWR formula (USCHO.com)
By request, UMD’s Mar. 5 outlook in graphical format (see table in main article above)…