The Sioux have an opportunity to make a move in the PairWise Rankings (PWR) and toward an NCAA tournament selection.
Last weekend, a sweep was necessary just to maintain UND’s ranking of #14. The Sioux did sweep and rose modestly to #13.
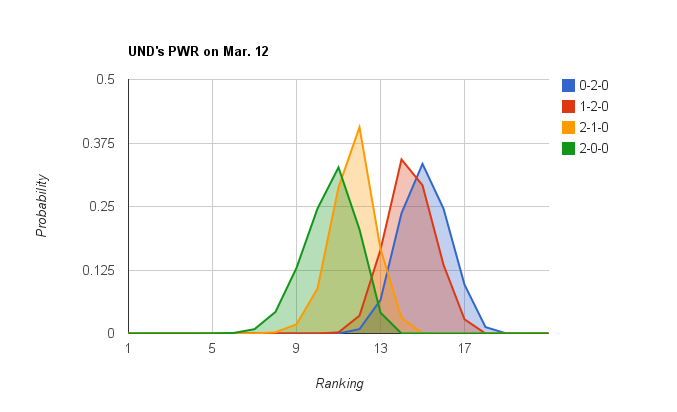
This weekend, a sweep could easily push UND up a couple more spots into the relative safety of a #10-#12 ranking.
Any outcome in which UND fails to advance, whether winning a single game or none, would leave UND on the bubble for the NCAA tournament. The #14 ranked team stands a fair chance of making the tournament — it does so if 2 or fewer teams outside the top 16 gets autobids. However, UND’s ranking would be quite likely to move a slot or two while the Sioux watched the Final Five from home, leaving UND’s destiny out of its hands.
| 0-2-0 | 1-2-0 | 2-1-0 | 2-0-0 | |
| 1 | 0.00% | 0.00% | 0.00% | 0.00% |
| 2 | 0.00% | 0.00% | 0.00% | 0.00% |
| 3 | 0.00% | 0.00% | 0.00% | 0.00% |
| 4 | 0.00% | 0.00% | 0.00% | 0.00% |
| 5 | 0.00% | 0.00% | 0.00% | 0.01% |
| 6 | 0.00% | 0.00% | 0.00% | 0.11% |
| 7 | 0.00% | 0.00% | 0.02% | 0.96% |
| 8 | 0.00% | 0.00% | 0.26% | 5.21% |
| 9 | 0.00% | 0.00% | 2.05% | 18.12% |
| 10 | 0.00% | 0.00% | 10.88% | 42.71% |
| 11 | 0.00% | 0.23% | 39.66% | 75.41% |
| 12 | 0.86% | 3.74% | 80.26% | 95.90% |
| 13 | 7.46% | 20.22% | 96.92% | 99.99% |
| 14 | 31.13% | 54.48% | 99.99% | 100.00% |
| 15 | 64.52% | 83.66% | 100.00% | 100.00% |
| 16 | 89.11% | 97.21% | 100.00% | 100.00% |
| 17 | 98.74% | 100.00% | 100.00% | 100.00% |
| 18 | 100.00% | 100.00% | 100.00% | 100.00% |
| 19 | 100.00% | 100.00% | 100.00% | 100.00% |
| 20 | 100.00% | 100.00% | 100.00% | 100.00% |
It doesn’t show up in the table (not enough decimal places), but there is about a 1/1,000,000 scenario in which UND comes out of the weekend #4 in the PWR and positioned for a 1 seed. The lowest likely rank, if swept, is #19.
Who else to watch this weekend
The two separate lists are the series UND cares most about if the Sioux win (outcomes that can flip other comparisons in UND’s favor) and the series that UND cares most about if the Sioux lose (outcomes that can flip comparisons away from UND).
If UND wins:
- Wisconsin over Denver (win series)
- Rensselaer over Union (one game if UND sweeps, series if UND goes 2-1)
- Alaska Anchorage over Minnesota (win series)
- Merrimack over Maine (win series if UND sweeps, not as important if UND goes 2-1)
If UND loses:
- Maine over Merrimack (win series)
- Michigan over Notre Dame (win series)
- Lake Superior over Wester Michigan (one game)
- Dartmouth over Cornell (win series)
The series listed are those that increase UND’s PWR by at least .75 on average.
Outlook for all NCAA teams
I didn’t run charts (like the UND chart above) for any teams other than UND yet, but the data is all in the table below. If you’d like to see any particular team in chart form, just let me know.
Here are the likely PWR rankings for each NCAA team as of March 12 (after all of this weekend’s best-of-3 series complete).
| Team | March 12 PWR Possibilities | ||
|---|---|---|---|
| Overall | Swept | Advance (2-1-0 or 2-0-0) | |
| Boston College | 1 85.1% 2 12.7% 3 1.4% 4 0.6% 5 0.2% 6 0.0% 7 0.0% |
1 27.6% 2 34.0% 3 23.6% 4 11.8% 5 2.9% 6 0.1% 7 0.0% |
1 89.4% 2 10.6% |
| Michigan | 1 2.2% 2 34.2% 3 15.4% 4 12.9% 5 13.9% 6 9.6% 7 5.4% 8 3.8% 9 1.8% 10 0.6% 11 0.1% 12 0.0% |
2 0.0% 3 0.6% 4 2.8% 5 11.3% 6 20.7% 7 26.4% 8 22.6% 9 11.1% 10 3.5% 11 0.8% 12 0.1% |
1 3.5% 2 53.5% 3 22.4% 4 14.3% 5 6.1% 6 0.3% 7 0.0% |
| Ferris State | 1 0.0% 2 13.0% 3 26.0% 4 27.3% 5 18.4% 6 6.9% 7 3.2% 8 2.8% 9 1.7% 10 0.6% 11 0.1% 12 0.0% |
2 0.0% 3 0.2% 4 1.5% 5 6.0% 6 12.8% 7 21.4% 8 27.3% 9 20.6% 10 8.2% 11 1.7% 12 0.2% |
1 0.1% 2 14.6% 3 29.3% 4 30.4% 5 19.5% 6 5.7% 7 0.5% 8 0.0% |
| Mass.-Lowell | 1 0.9% 2 18.4% 3 27.7% 4 16.0% 5 10.2% 6 9.2% 7 6.7% 8 3.4% 9 2.5% 10 2.6% 11 1.8% 12 0.5% 13 0.0% |
2 0.0% 3 0.4% 4 1.4% 5 5.0% 6 12.1% 7 16.8% 8 15.4% 9 14.2% 10 16.9% 11 12.5% 12 4.7% 13 0.5% |
1 1.1% 2 22.0% 3 33.0% 4 18.6% 5 10.8% 6 8.4% 7 4.9% 8 1.2% 9 0.1% 10 0.0% 11 0.0% |
| Boston University | 1 0.0% 2 0.4% 3 3.2% 4 13.5% 5 23.7% 6 22.6% 7 11.5% 8 6.6% 9 5.6% 10 6.6% 11 5.0% 12 1.2% 13 0.2% |
5 0.0% 6 0.2% 7 1.5% 8 5.6% 9 16.3% 10 31.9% 11 31.0% 12 11.6% 13 1.9% |
1 0.0% 2 0.5% 3 4.1% 4 17.2% 5 30.2% 6 28.5% 7 13.1% 8 5.0% 9 1.2% 10 0.1% 11 0.0% |
| Miami | 1 0.1% 2 0.8% 3 3.0% 4 6.0% 5 7.8% 6 8.2% 7 7.5% 8 9.5% 9 9.7% 10 7.0% 11 14.1% 12 17.1% 13 8.9% 14 0.2% 15 0.0% |
7 0.0% 8 0.0% 9 0.2% 10 4.6% 11 22.7% 12 41.5% 13 29.9% 14 0.9% 15 0.0% |
1 0.2% 2 1.5% 3 5.9% 4 11.9% 5 15.3% 6 16.2% 7 14.5% 8 17.0% 9 13.7% 10 3.2% 11 0.6% 12 0.0% |
| UMD | 1 11.6% 2 20.4% 3 22.4% 4 19.8% 5 12.3% 6 7.3% 7 3.7% 8 1.7% 9 0.6% 10 0.2% 11 0.1% 12 0.0% 13 0.0% |
2 0.1% 3 1.7% 4 7.3% 5 16.4% 6 25.3% 7 22.7% 8 14.6% 9 7.5% 10 3.0% 11 1.0% 12 0.2% 13 0.0% |
1 12.7% 2 22.4% 3 24.4% 4 20.7% 5 11.5% 6 5.5% 7 2.1% 8 0.6% 9 0.1% 10 0.0% 11 0.0% |
| Michigan State | 3 0.0% 4 0.0% 5 0.0% 6 0.5% 7 2.1% 8 6.8% 9 13.4% 10 15.4% 11 9.9% 12 9.5% 13 17.9% 14 14.3% 15 7.7% 16 2.1% 17 0.4% 18 0.0% 19 0.0% |
10 0.0% 11 0.1% 12 8.2% 13 28.8% 14 32.8% 15 21.3% 16 7.1% 17 1.4% 18 0.2% 19 0.0% |
3 0.0% 4 0.0% 5 0.1% 6 1.0% 7 4.4% 8 13.8% 9 27.2% 10 31.2% 11 17.9% 12 3.5% 13 0.8% 14 0.1% |
| UMN | 2 0.0% 3 0.3% 4 2.1% 5 7.5% 6 19.3% 7 25.8% 8 15.3% 9 10.1% 10 8.3% 11 6.0% 12 3.7% 13 1.6% 14 0.1% 15 0.0% |
7 0.0% 8 0.1% 9 1.0% 10 7.0% 11 20.6% 12 37.8% 13 30.8% 14 2.7% 15 0.1% |
2 0.0% 3 0.4% 4 2.3% 5 8.1% 6 21.0% 7 28.0% 8 16.6% 9 10.7% 10 7.8% 11 4.1% 12 1.1% 13 0.0% |
| Maine | 2 0.0% 3 0.0% 4 0.1% 5 0.5% 6 2.1% 7 5.5% 8 11.7% 9 16.1% 10 14.4% 11 11.6% 12 10.3% 13 8.7% 14 9.2% 15 5.7% 16 3.0% 17 0.9% 18 0.2% 19 0.0% 20 0.0% 21 0.0% |
11 0.2% 12 3.7% 13 15.8% 14 32.6% 15 27.6% 16 14.6% 17 4.5% 18 1.0% 19 0.1% 20 0.0% 21 0.0% |
2 0.0% 3 0.0% 4 0.1% 5 0.9% 6 3.6% 7 9.6% 8 20.4% 9 28.0% 10 23.1% 11 10.6% 12 3.2% 13 0.5% |
| Denver | 1 0.0% 2 0.0% 3 0.1% 4 0.5% 5 1.3% 6 3.2% 7 6.5% 8 11.9% 9 17.6% 10 19.3% 11 16.3% 12 11.9% 13 7.1% 14 2.4% 15 1.3% 16 0.5% 17 0.1% |
9 0.0% 10 1.7% 11 12.3% 12 27.8% 13 28.7% 14 16.0% 15 9.3% 16 3.7% 17 0.5% |
1 0.0% 2 0.0% 3 0.1% 4 0.7% 5 1.9% 6 4.6% 7 9.5% 8 17.2% 9 25.2% 10 25.2% 11 13.5% 12 2.1% |
| UND | 10 0.0% 11 0.2% 12 3.5% 13 16.5% 14 34.3% 15 29.1% 16 13.6% 17 2.8% |
n/a | n/a |
| Notre Dame | 8 0.0% 9 0.0% 10 0.1% 11 1.2% 12 4.9% 13 8.7% 14 9.6% 15 7.9% 16 6.3% 17 10.2% 18 20.9% 19 25.7% 20 4.4% 21 0.1% |
15 0.0% 16 0.2% 17 5.2% 18 25.1% 19 56.5% 20 12.6% 21 0.4% |
8 0.0% 9 0.0% 10 0.4% 11 3.2% 12 13.4% 13 23.9% 14 26.4% 15 21.0% 16 10.6% 17 1.0% |
| Western Michigan | 11 0.1% 12 0.7% 13 5.1% 14 12.6% 15 16.1% 16 14.6% 17 8.7% 18 5.0% 19 14.3% 20 20.7% 21 2.2% 22 0.0% |
17 0.0% 18 4.3% 19 28.1% 20 59.2% 21 8.3% 22 0.1% |
11 0.1% 12 1.2% 13 9.0% 14 22.0% 15 28.3% 16 25.3% 17 13.3% 18 0.7% 19 0.0% |
| Northern Michigan | 13 0.3% 14 4.4% 15 20.8% 16 31.5% 17 25.8% 18 13.8% 19 3.4% 20 0.1% 21 0.0% |
n/a | n/a |
| Merrimack | 6 0.0% 7 0.0% 8 0.1% 9 1.0% 10 4.2% 11 9.9% 12 11.8% 13 10.3% 14 5.0% 15 3.0% 16 7.4% 17 14.8% 18 16.3% 19 11.6% 20 3.8% 21 0.8% 22 0.1% 23 0.0% |
14 0.0% 15 0.2% 16 2.2% 17 12.4% 18 34.1% 19 35.6% 20 12.4% 21 2.8% 22 0.3% 23 0.0% |
6 0.0% 7 0.0% 8 0.3% 9 2.3% 10 9.8% 11 23.2% 12 27.7% 13 24.0% 14 10.9% 15 1.9% 16 0.0% |
| Union | 2 0.0% 3 0.3% 4 1.3% 5 4.3% 6 11.0% 7 21.7% 8 24.7% 9 14.9% 10 10.1% 11 6.6% 12 3.7% 13 1.1% 14 0.1% 15 0.0% |
7 0.0% 8 0.6% 9 4.4% 10 13.5% 11 28.6% 12 32.8% 13 16.7% 14 3.1% 15 0.4% |
2 0.0% 3 0.3% 4 1.5% 5 4.8% 6 12.2% 7 24.1% 8 27.2% 9 15.8% 10 9.2% 11 3.9% 12 0.8% 13 0.0% 14 0.0% |
| Lake Superior | 14 0.0% 15 0.5% 16 4.1% 17 12.2% 18 15.7% 19 12.4% 20 11.1% 21 11.6% 22 14.4% 23 11.7% 24 5.0% 25 1.2% 26 0.1% |
18 0.0% 19 0.1% 20 1.8% 21 10.4% 22 34.1% 23 34.1% 24 15.3% 25 3.8% 26 0.4% |
14 0.0% 15 1.1% 16 9.6% 17 28.3% 18 36.0% 19 20.4% 20 3.8% 21 0.8% 22 0.1% 23 0.0% |
| Ohio State | 18 0.3% 19 6.6% 20 24.0% 21 33.4% 22 24.4% 23 9.9% 24 1.5% 25 0.1% |
n/a | n/a |
| CC | 13 0.0% 14 0.3% 15 3.5% 16 11.7% 17 18.6% 18 21.8% 19 17.4% 20 6.9% 21 10.2% 22 6.6% 23 2.3% 24 0.7% 25 0.1% |
18 0.7% 19 4.3% 20 17.2% 21 33.5% 22 27.4% 23 11.9% 24 4.3% 25 0.7% |
13 0.0% 14 0.4% 15 5.0% 16 16.7% 17 26.6% 18 30.4% 19 20.2% 20 0.7% 21 0.0% |
| Cornell | 4 0.0% 5 0.0% 6 0.1% 7 0.4% 8 1.8% 9 5.0% 10 10.5% 11 17.2% 12 21.1% 13 13.7% 14 7.4% 15 4.5% 16 5.3% 17 5.6% 18 5.0% 19 2.3% 20 0.1% |
13 0.0% 14 0.5% 15 4.9% 16 16.0% 17 27.6% 18 31.7% 19 18.4% 20 0.8% |
4 0.0% 5 0.0% 6 0.1% 7 0.5% 8 2.3% 9 6.4% 10 13.6% 11 22.1% 12 27.2% 13 17.2% 14 8.3% 15 1.9% 16 0.3% 17 0.0% |
| Northeastern | 23 0.0% 24 0.1% 25 1.7% 26 9.1% 27 22.4% 28 29.7% 29 23.3% 30 10.5% 31 2.7% 32 0.5% 33 0.1% 34 0.0% |
n/a | n/a |
| SCSU | 19 0.0% 20 0.2% 21 2.2% 22 9.5% 23 14.8% 24 14.4% 25 12.6% 26 7.3% 27 5.3% 28 6.6% 29 5.8% 30 5.3% 31 6.1% 32 4.7% 33 1.5% 34 0.1% Non-TUC 3.6% |
27 0.0% 28 0.2% 29 2.5% 30 13.1% 31 30.4% 32 25.6% 33 8.1% 34 0.6% Non-TUC 19.6% |
19 0.0% 20 0.4% 21 3.6% 22 15.7% 23 24.5% 24 23.8% 25 20.6% 26 9.7% 27 1.7% 28 0.0% |
| Bemidji State | 20 0.0% 21 0.4% 22 4.1% 23 23.2% 24 35.9% 25 26.2% 26 9.9% 27 0.3% 28 0.0% |
n/a | n/a |
| UW | 17 0.0% 18 0.3% 19 2.8% 20 9.0% 21 8.7% 22 7.0% 23 5.6% 24 4.5% 25 8.3% 26 14.1% 27 13.1% 28 11.1% 29 9.1% 30 4.8% 31 1.3% 32 0.2% 33 0.0% 34 0.0% |
22 0.1% 23 0.6% 24 1.2% 25 2.6% 26 11.0% 27 20.0% 28 25.8% 29 22.8% 30 12.2% 31 3.2% 32 0.4% 33 0.0% 34 0.0% |
17 0.0% 18 1.0% 19 8.9% 20 29.1% 21 27.1% 22 19.1% 23 10.8% 24 3.5% 25 0.4% 26 0.0% |
| Massachusetts | 20 0.0% 21 0.0% 22 0.2% 23 0.6% 24 1.1% 25 2.7% 26 4.4% 27 3.4% 28 2.5% 29 4.9% 30 9.8% 31 7.9% 32 2.7% 33 0.7% 34 0.1% 35 0.0% Non-TUC 59.1% |
Non-TUC 100.0% | 20 0.0% 21 0.2% 22 1.4% 23 4.1% 24 8.1% 25 19.8% 26 32.3% 27 23.3% 28 8.7% 29 1.8% 30 0.3% 31 0.0% 32 0.0% |
| New Hampshire | 23 0.0% 24 0.0% 25 0.8% 26 3.6% 27 6.1% 28 5.4% 29 3.6% 30 2.7% 31 3.1% 32 3.0% 33 0.7% 34 0.0% Non-TUC 70.8% |
Non-TUC 100.0% | 23 0.0% 24 0.2% 25 3.7% 26 16.6% 27 28.0% 28 24.9% 29 15.5% 30 7.7% 31 2.6% 32 0.6% 33 0.1% 34 0.0% |
| Nebraska-Omaha | 23 0.0% 24 0.0% 25 0.2% 26 0.9% 27 2.7% 28 4.7% 29 7.8% 30 7.2% 31 7.1% 32 5.8% 33 2.5% 34 0.5% 35 0.0% Non-TUC 60.6% |
Non-TUC 100.0% | 23 0.0% 24 0.0% 25 0.4% 26 2.4% 27 6.7% 28 11.9% 29 19.7% 30 18.2% 31 17.9% 32 14.7% 33 6.2% 34 1.2% 35 0.1% Non-TUC 0.5% |
| Harvard | 17 0.0% 18 0.2% 19 2.0% 20 10.2% 21 10.3% 22 10.9% 23 11.4% 24 12.6% 25 9.8% 26 7.6% 27 6.0% 28 2.7% 29 2.6% 30 5.6% 31 5.8% 32 2.2% 33 0.2% 34 0.0% |
26 0.0% 27 0.1% 28 2.0% 29 13.7% 30 34.3% 31 35.7% 32 13.3% 33 0.9% 34 0.0% |
17 0.0% 18 0.2% 19 3.1% 20 15.9% 21 16.1% 22 17.0% 23 17.7% 24 18.5% 25 10.0% 26 1.5% 27 0.0% |
| Alaska | Non-TUC 100.0% | n/a | n/a |
| Providence | Non-TUC 100.0% | Non-TUC 100.0% | Non-TUC 100.0% |
| MTech | Non-TUC 100.0% | Non-TUC 100.0% | Non-TUC 100.0% |
| Quinnipiac | 16 0.0% 17 0.1% 18 0.5% 19 1.2% 20 4.0% 21 6.5% 22 10.2% 23 11.4% 24 10.6% 25 9.3% 26 9.7% 27 10.6% 28 9.6% 29 8.9% 30 5.2% 31 1.7% 32 0.5% 33 0.1% 34 0.0% |
24 0.1% 25 1.1% 26 3.8% 27 9.9% 28 21.9% 29 32.9% 30 20.8% 31 6.9% 32 2.0% 33 0.4% 34 0.0% |
16 0.0% 17 0.1% 18 1.0% 19 2.5% 20 8.0% 21 12.9% 22 20.3% 23 22.6% 24 20.1% 25 11.0% 26 1.5% 27 0.0% |
| Colgate | 18 0.0% 19 0.3% 20 5.6% 21 13.5% 22 12.6% 23 8.7% 24 6.6% 25 4.6% 26 4.2% 27 6.1% 28 7.8% 29 7.1% 30 9.1% 31 8.8% 32 3.5% 33 0.8% 34 0.1% Non-TUC 0.7% |
25 0.0% 26 0.1% 27 0.7% 28 3.4% 29 13.0% 30 29.1% 31 33.6% 32 13.8% 33 3.1% 34 0.2% Non-TUC 2.9% |
18 0.0% 19 0.6% 20 11.2% 21 27.1% 22 25.2% 23 17.1% 24 12.0% 25 6.0% 26 0.6% 27 0.2% 28 0.0% |
| Bowling Green | Non-TUC 100.0% | Non-TUC 100.0% | Non-TUC 100.0% |
| Yale | 23 0.0% 24 0.2% 25 1.4% 26 3.4% 27 4.6% 28 3.9% 29 4.0% 30 5.5% 31 6.4% 32 4.1% 33 1.6% 34 0.5% 35 0.1% Non-TUC 64.3% |
Non-TUC 100.0% | 23 0.1% 24 0.7% 25 3.8% 26 9.5% 27 12.9% 28 11.0% 29 11.2% 30 15.5% 31 17.9% 32 11.4% 33 4.5% 34 1.3% 35 0.1% |
| Dartmouth | Non-TUC 100.0% | Non-TUC 100.0% | Non-TUC 100.0% |
| St. Lawrence | Non-TUC 100.0% | n/a | n/a |
| Mankato | Non-TUC 100.0% | Non-TUC 100.0% | Non-TUC 100.0% |
| Clarkson | Non-TUC 100.0% | n/a | n/a |
| Air Force | 22 0.0% 23 0.4% 24 6.9% 25 20.9% 26 23.8% 27 14.3% 28 6.1% 29 2.5% 30 0.7% 31 0.5% 32 0.7% 33 0.5% 34 0.2% 35 0.0% Non-TUC 22.5% |
Non-TUC 100.0% | 22 0.0% 23 0.5% 24 9.1% 25 27.7% 26 31.6% 27 19.0% 28 8.0% 29 3.3% 30 0.7% 31 0.0% |
| RIT | 23 0.0% 24 0.0% 25 0.2% 26 1.4% 27 3.8% 28 6.0% 29 11.1% 30 16.2% 31 13.8% 32 11.4% 33 6.0% 34 1.6% 35 0.2% Non-TUC 28.6% |
Non-TUC 100.0% | 23 0.0% 24 0.0% 25 0.2% 26 1.9% 27 5.2% 28 8.4% 29 15.5% 30 22.6% 31 19.3% 32 15.9% 33 8.3% 34 2.3% 35 0.3% Non-TUC 0.0% |
| Niagara | 24 0.0% 25 0.1% 26 0.4% 27 1.4% 28 3.9% 29 8.8% 30 13.0% 31 15.2% 32 11.6% 33 5.9% 34 1.4% 35 0.1% Non-TUC 38.3% |
Non-TUC 100.0% | 24 0.0% 25 0.1% 26 0.7% 27 2.3% 28 6.3% 29 14.2% 30 21.0% 31 24.6% 32 18.7% 33 9.5% 34 2.3% 35 0.2% Non-TUC 0.0% |
| AA | Non-TUC 100.0% | Non-TUC 100.0% | Non-TUC 100.0% |
| Princeton | Non-TUC 100.0% | n/a | n/a |
| Rensselaer | Non-TUC 100.0% | Non-TUC 100.0% | Non-TUC 100.0% |
| Mercyhurst | Non-TUC 100.0% | Non-TUC 100.0% | Non-TUC 100.0% |
| Holy Cross | Non-TUC 100.0% | Non-TUC 100.0% | Non-TUC 100.0% |
| Robert Morris | Non-TUC 100.0% | Non-TUC 100.0% | Non-TUC 100.0% |
| Vermont | Non-TUC 100.0% | n/a | n/a |
| Brown | Non-TUC 100.0% | n/a | n/a |
| Bentley | Non-TUC 100.0% | Non-TUC 100.0% | Non-TUC 100.0% |
| Connecticut | Non-TUC 100.0% | Non-TUC 100.0% | Non-TUC 100.0% |
| Canisius | Non-TUC 100.0% | n/a | n/a |
| Alabama-Huntsville | Non-TUC 100.0% | n/a | n/a |
| American Int’l | Non-TUC 100.0% | n/a | n/a |
| Army | Non-TUC 100.0% | n/a | n/a |
| Sacred Heart | Non-TUC 100.0% | n/a | n/a |
This is probably the last time this season I’ll publish the entire NCAA. Next week I’ll pare it down to those within sight of making the NCAA tournament.
Methodology
Each forecast is based on at least one million monte carlo simulations of the games in the described period. For each simulation, the PairWise Ranking (PWR) is calculated and the results tallied. The probabilities presented in the forecasts are the share of simulations in which a particular outcome occurred.
The outcome of each game in each simulation is determined by random draw, with the probability of victory for each team set by their relative KRACH ratings. So, if the simulation set included a contest between team A with KRACH 300 and team B with KRACH 100, team A will win the game in very close to 75% of the simulations.
Resources
- Current PWR Rankings (SiouxSports.com)
- CHN PWR Rankings (CollegeHockeyNews.com)
- TBRW build your own rankings (slack.net)
- Explanation of how PWR mimics NCAA tournament selection (CollegeHockeyNews.com)
- A first look at the PairWise Rankings and UND’s tournament possibilities
- Change to COP calculation in PWR formula (USCHO.com)
outstanding as always, thanks
Jim, I assumed NMU was dead after being swept by Bowling Green this weekend. What needs to happen this week for the Wildcats to rise to No. 15?
First I want to go quickly over how teams on the bubble get in. There are two things to watch:
* The PWR rank
* The number of teams that win conference tournaments that aren’t in the top 16
Because exactly 16 teams make the tournament, every team that’s not in the top 16 that gets an autobid essentially chops off a ranked team. So, #16 won’t make it because the AHA autobid won’t be ranked. If every other conference is won by a top 16 team, #15 makes it. If two additional conferences are won by unranked teams, only #13 makes it.
I’m emphasizing that, because for a team like NMU that isn’t playing anymore, it’s going to be difficult to move much so having the right teams get the autobids is the most important factor.
Talking generally about NMU, what killed them this weekend was the RPI drop from the losses. Looking at the comparison they’re losing (on the NMU PWR details page), Merrimack and Cornell can be overtaken on RPI if they lose, each of which would give NMU the comparison.
While NMU’s record vs. existing TUCs isn’t going to change, the TUC cliff could still change (that is, teams that NMU has played could become or fall out of being TUCs, thus affecting NMU’s TUC record). None of the comparisons jump out as being particularly likely to flip for that reason, but it can be tricky. TUC comparisons could also flip by an opposing TUC losing vs. a TUC and having its record drop.
Finally, the COP comparisons can still change as TUCs play teams that NMU has played. Again, none of the comparisons NMU is losing jump out at me as likely to flip in NMU’s favor.
That should give you a good idea how to read the PWR details, and I’ll give a more specific answer as to exactly what, this weekend, can push the Wildcats to #15 tomorrow. The bottom line is that NMU isn’t mathematically eliminated yet, but it’s going to take some luck.
How much time does this normally take you Jim? It’s much appreciated.
Ok, here’s what the models say. This weekend, Northern Michigan is most helped by:
Michigan defeating Notre Dame
Lake Superior defeating Western Michigan
Then, a little less by:
Dartmouth defeating Cornell
Maine defeating Merrimack
Merrimack and Cornell, as noted in my previous posts, are two comparisons that Northern Michigan is currently losing but can be flipped on the basis of RPI if those teams lose.
Notre Dame and Western Michigan are important in the other direction — those are comparisons that Northern Michigan is currently winning by very narrow RPI margins, so would lose if those teams did too well.
Thanks for the good info! Anyone ever tell you that you look a lot like Niel Patrick Harris?
Thanks Jim. I appreciate the insight.
He’s frequently complained that people are always asking, ”
who’s that guy who looks like Jim Dahl?”
That’s a tough question… most of the time is sunk into trying to further automate things. The simulations only run for an hour or so, entirely unattended. Making the graphs is still a manual process, probably takes another hour. So, writing one article is probably half a day.
But, the big time investment is in the programs that do the simulations. I’ve been working on them for years.
Where is Northern Michigan at today with last nights results? Can NMU overtake Michigan State with a Spartan loss? What if Lake Superior win one game againist Western Michigan or better yet 2? Thanks for this information!