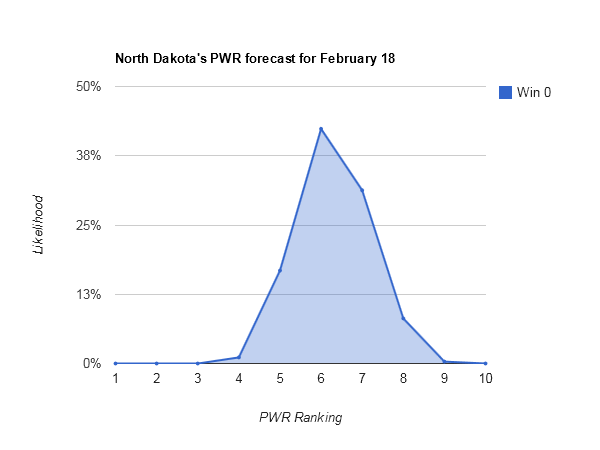
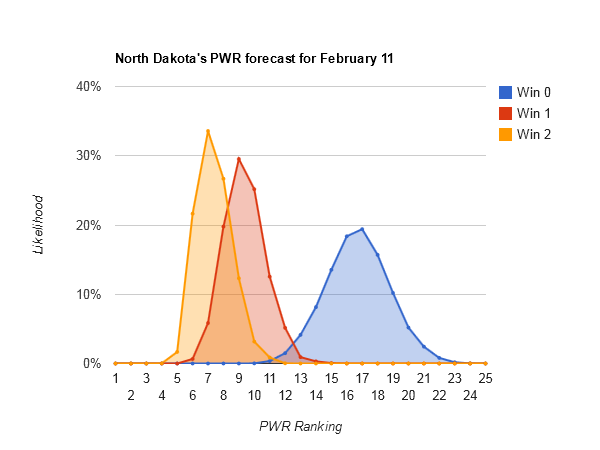
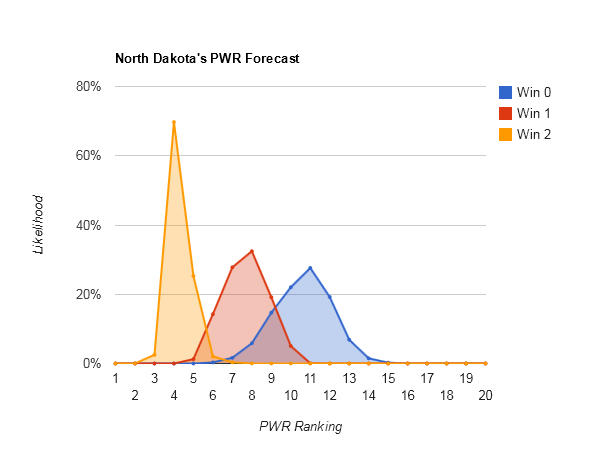
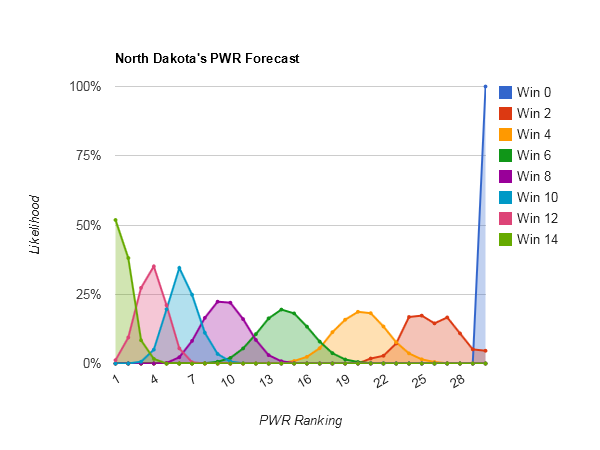
Idle #6 North Dakota could make some small moves in the Pairwise Rankings (PWR) this week, with anything between 5 and 8 being reasonably likely.
Key games for UND
| Matchup | Number of wins |
Effect on UND’s PWR |
|---|---|---|
| Ohio State over Western Michigan | (1 of 2) | 1.13 |
| Ohio State over Western Michigan | (2 of 2) | 1.05 |
The reason those games (and others) are important can be deduced by studying the PWR comparison details for UND.
UND’s downside potential
Western Michigan is clearly the bigggest threat this week, with UND currently winning the comparison on the back of a very narrow .5470 to .5454 RPI lead.
Niagara is similarly knocking on the door, losing the comparison to UND only on the basis of Niagara’s RPI of .5381.
Finally, Yale could take the comparison with UND by defeating both Union and Rensselaer, thus raising their TUC record to .5667 (vs. UND’s .5470).
UND’s upside potential
Though New Hampshire is winning the comparison to UND 3-0, two of those criteria would flip to UND if New Hampshire got swept. UND could take both RPI and TUC.
Other interesting teams this week
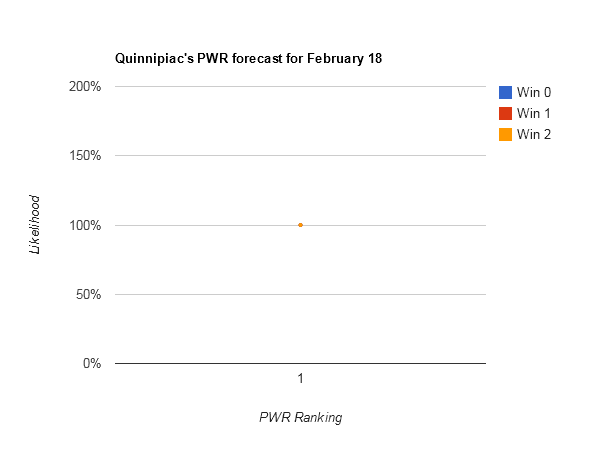
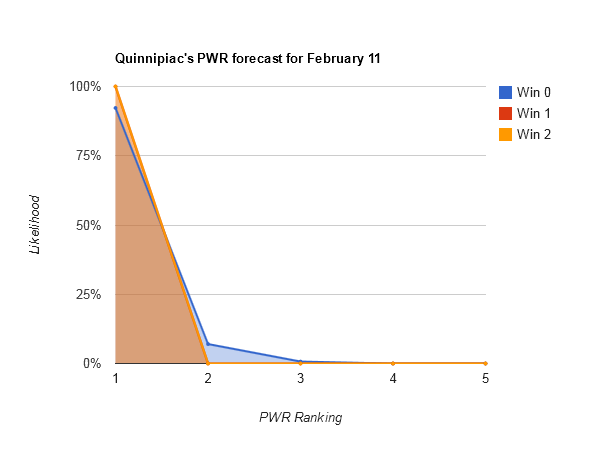
Smallest range of outcomes — #1 Quinnipiac (#1-#1). Sorry Gopher fans, not this week.
Of the teams that have a two comparison or less deficit with Quinnipiac [Quinnipiac PWR comparisons] (only North Dakota, MSU-Mankato, Niagara, Wisconsin, Providence, Holy Cross, and Robert Morris), none can hope to catch their RPI of .5885 any time soon.
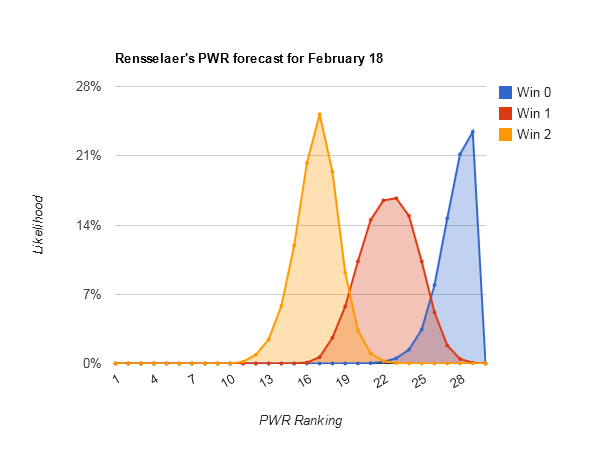
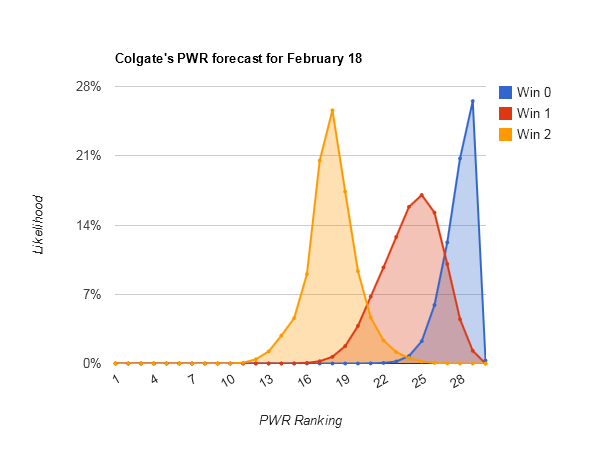
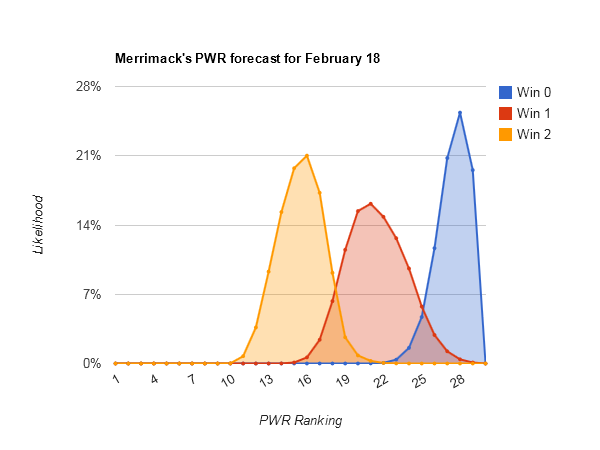
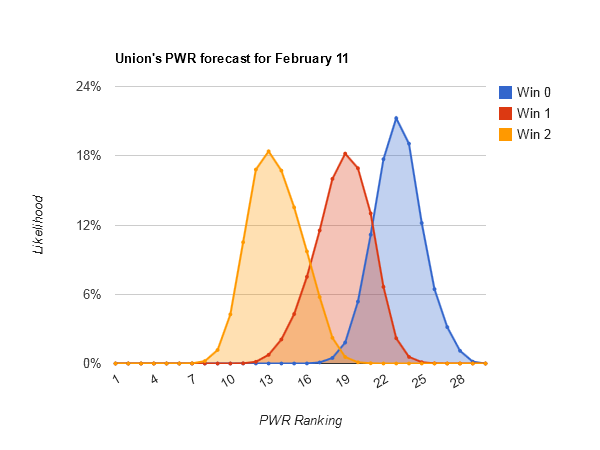
Largest range of outcomes — #23 Rensselaer (#13-#32), #25 Colgate (#13-#32), and #20 Merrimack (#12-#31)
Looking at Rensselaer PWR comparisons, Colgate PWR comparisons, and Merrimack PWR comparisons, all have fairly middling RPIs in the .5100s and quite a few comparisons being decided by RPI. That creates a lot of opportunity for both upward and downward movement from that part of the comparison table.
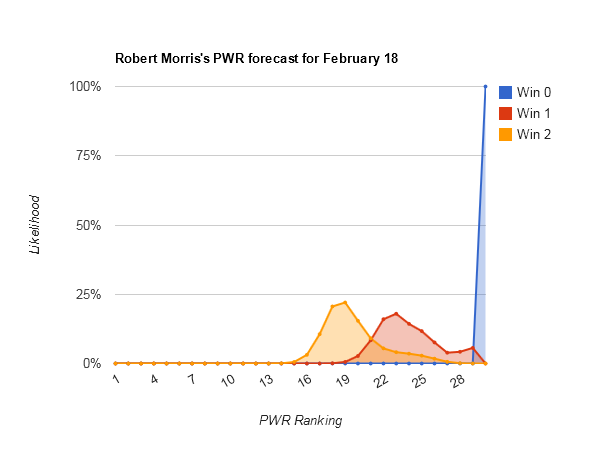
Most upside potential — #31 Robert Morris (#16–non-TUC)
Robert Morris’s story is simple (Robert Morris PWR comparisons): The TUC criterion hasn’t come into play for them yet because they don’t have 10 games and a sweep this weekend (at least a win seems necessary to stay a TUC) would give them an impressive .700 record vs. TUCs. That would immediately flip a lot of the 1-1 comparisons, and some of the 0-2’s vs teams that Robert Morris can overtake on RPI.
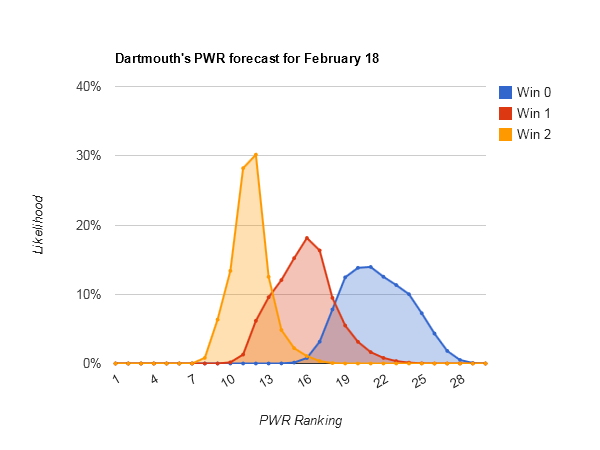
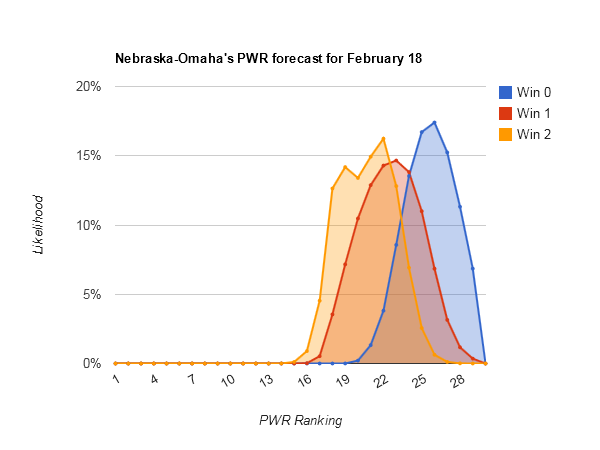
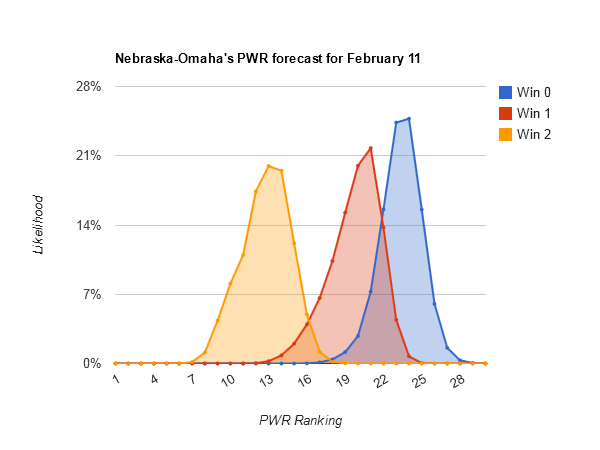
Most downside potential — #14 Dartmouth (#9-#27), #18 Nebraska-Omaha (#17-#31)
Dartmouth is tricky; just looking at Dartmouth’s PWR comparisons, it’s not immediately obvious why #14 Dartmouth has so much more downside potential than #15 Alaska [Alaska PWR comparisons], as RPIs and TUCs are similar. Fortunately, the simulations keep track of which games have the biggest effects on each teams, and there’s a valuable clue there:
| Matchup | Number of wins |
Effect on Dartmouth’s PWR |
|---|---|---|
| Dartmouth over Colgate | 5.55 | |
| Dartmouth over Cornell | 3.94 | |
| Brown over Rensselaer | 1.56 | |
| Brown over Union | 1.52 | |
| Miami over Notre Dame | (2 of 2) | 0.98 |
| Lake Superior over Alaska | (2 of 2) | 0.84 |
| Minnesota over Wisconsin | (2 of 2) | 0.80 |
| Minnesota over Wisconsin | (1 of 2) | 0.61 |
| Massachusetts over Mass.-Lowell | (1 of 2) | 0.58 |
| Lake Superior over Alaska | (1 of 2) | 0.52 |
| Robert Morris over Niagara | (2 of 2) | 0.51 |
The first thing that jumps out is how much Dartmouth wants Brown to win. It turns out that Brown is in danger of not being a TUC, and Dartmouth has 3 wins vs. Brown. Losing those wins would drop Dartmouth’s TUC record from .5333 to .4167. That gives Dartmouth significantly more downside potential with a couple losses than similarly ranked teams with similar RPIs.
Nebraska-Omaha [PWR comparisons], on the other hand, just has a miserable TUC of .3824. Alaska-Anchorage is a weak enough opponent that getting swept would push UNOs RPI from .5196 to about .5086. That would be enough on today’s RPI chart to drop UNO from #17 to #27 in RPI, certainly flipping a lot of comparisons given the poor TUC record. UNO seems to need a sweep not to fall.
Methodology
Each forecast is based on at least one million monte carlo simulations of the games in the described period. For each simulation, the PairWise Ranking (PWR) is calculated and the results tallied. The probabilities presented in the forecasts are the share of simulations in which a particular outcome occurred.
The outcome of each game in each simulation is determined by random draw, with the probability of victory for each team set by their relative KRACH ratings. So, if the simulation set included a contest between team A with KRACH 300 and team B with KRACH 100, team A will win the game in very close to 75% of the simulations. I don’t simulate ties or home ice advantage.
Resources
- Current PWR Rankings (SiouxSports.com)
- Current RPI Rankings (SiouxSports.com)
- CHN PWR Rankings (CollegeHockeyNews.com)
- TBRW build your own rankings (slack.net)
- Explanation of how PWR mimics NCAA tournament selection (CollegeHockeyNews.com)
