Best of three weekend Pairwise possibilities

This is the last week we look at single week ranking probabilities, after this the “You are the Committee” calculators will go live and we’ll give you the rundown on all remaining possible outcomes.

It’s an interesting week, with a lot of teams’ fortunes still at play.

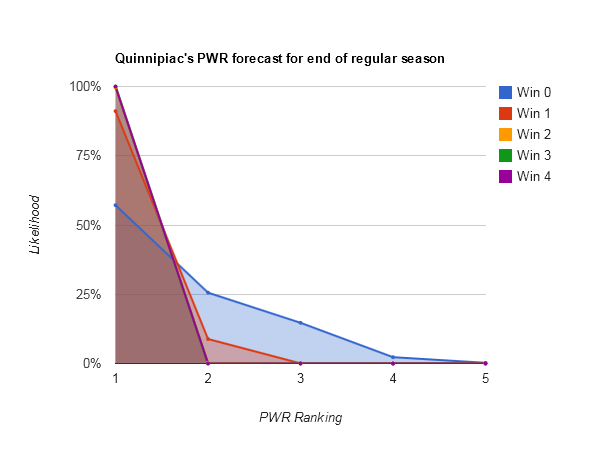
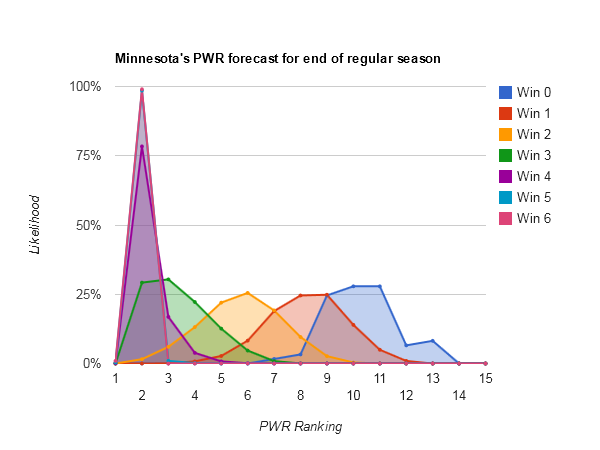
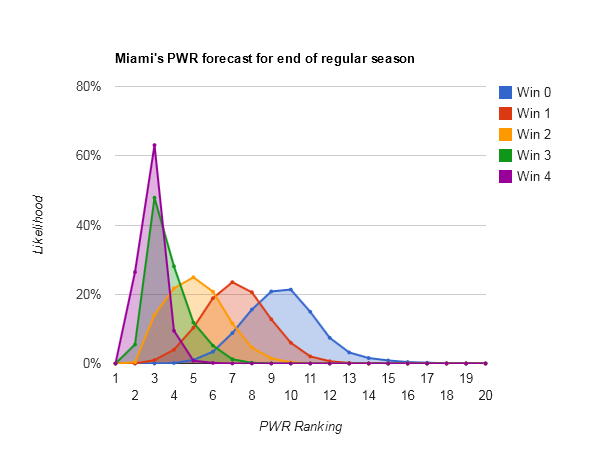
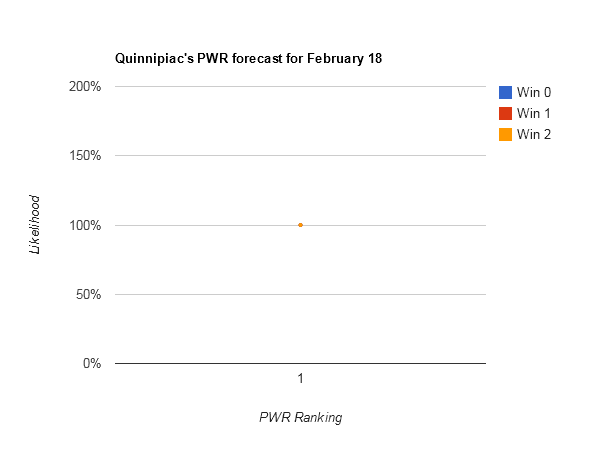
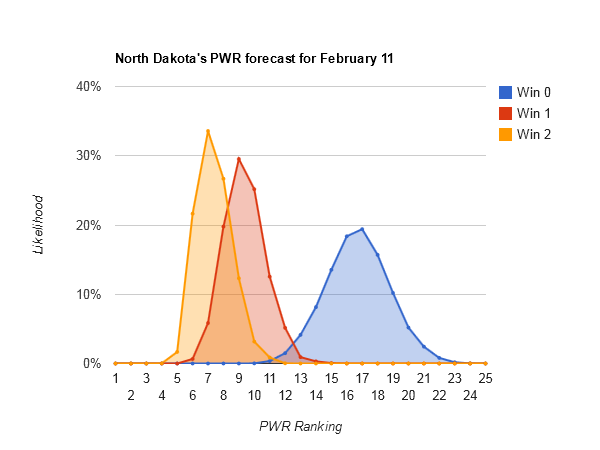
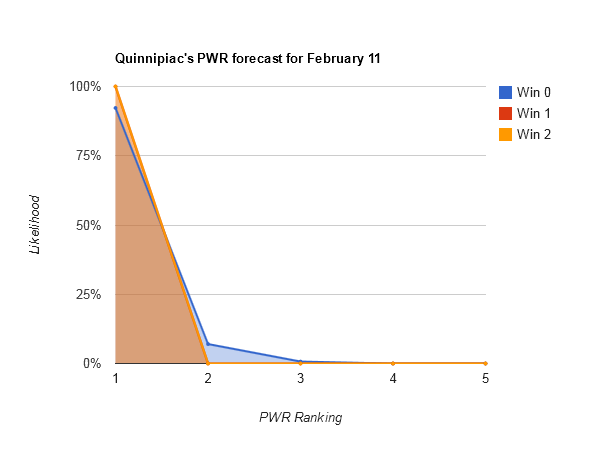
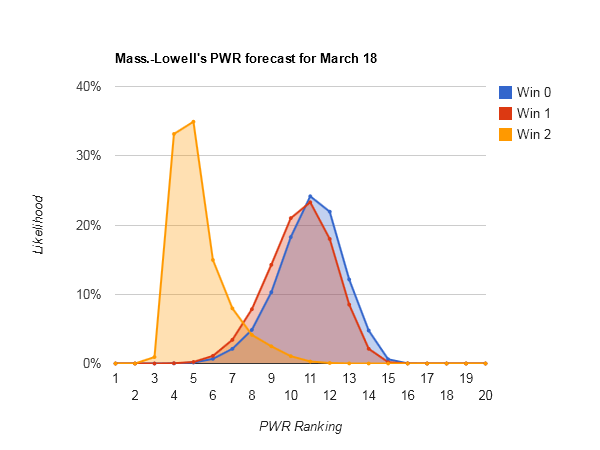
While the first three (#1 Quinnipiac, #2 Minnesota, and #3 Miami) in the Pairwise Rankings are reasonably secure, it starts to get interesting at #4 Mass.-Lowell. The Riverhawks are likely to stay #4-5 if they emerge from the best of 3, but plummet if they get eliminated.

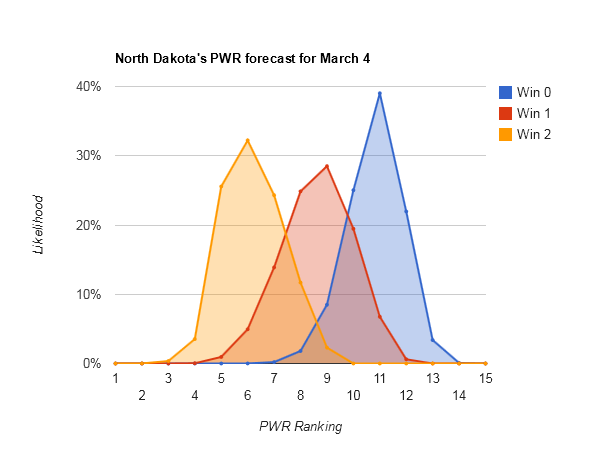
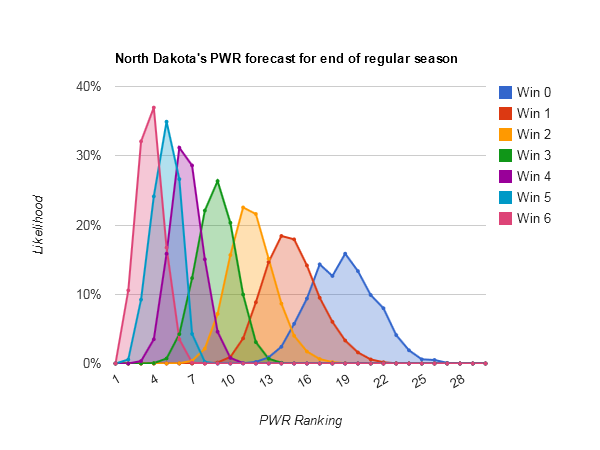
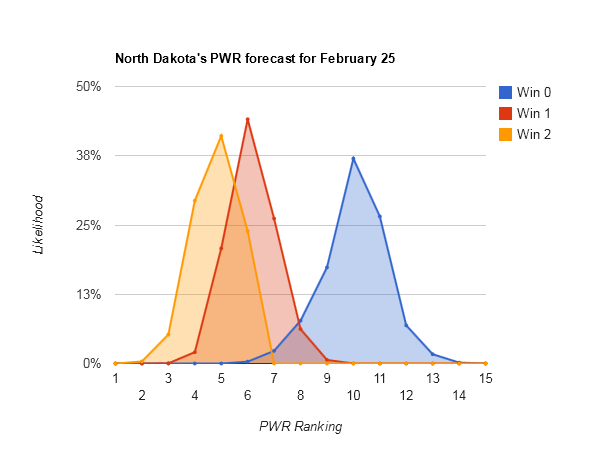
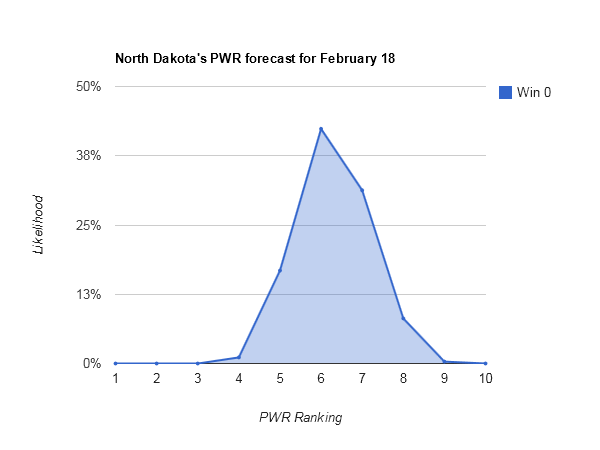
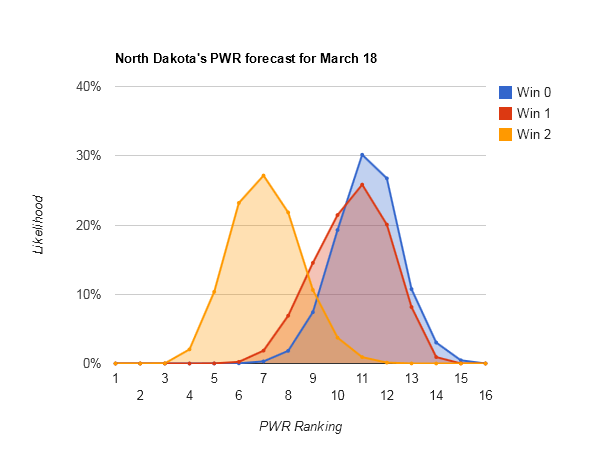
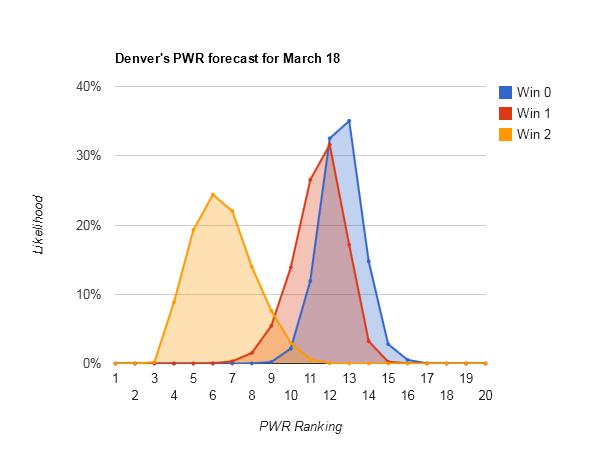
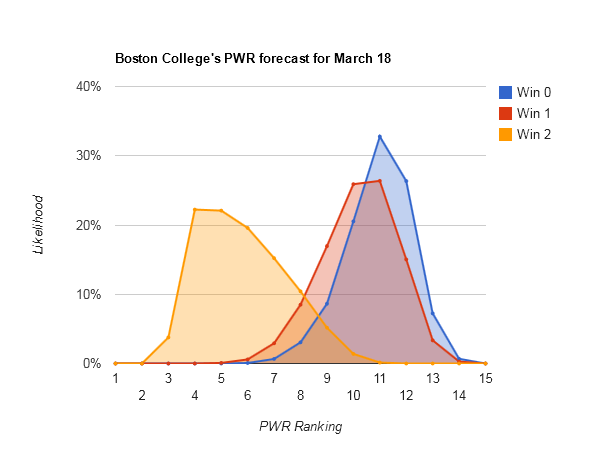
The same holds true for #5 North Dakota, #6 Denver, and #7 Boston College.

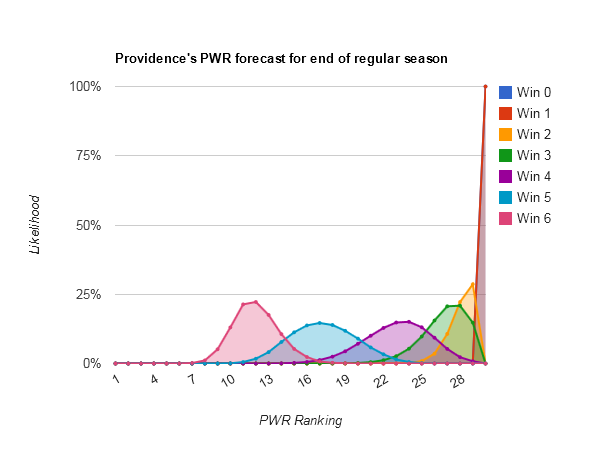
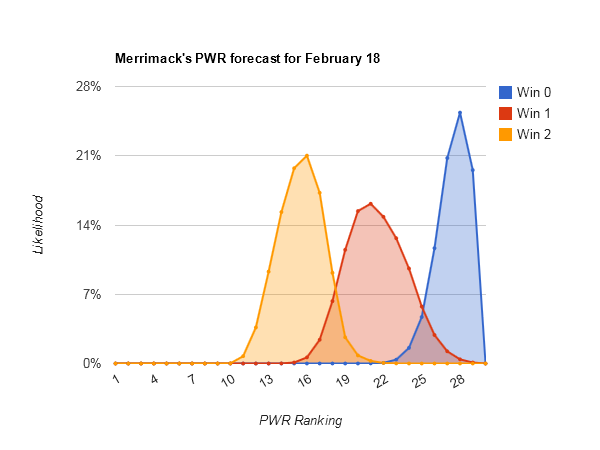
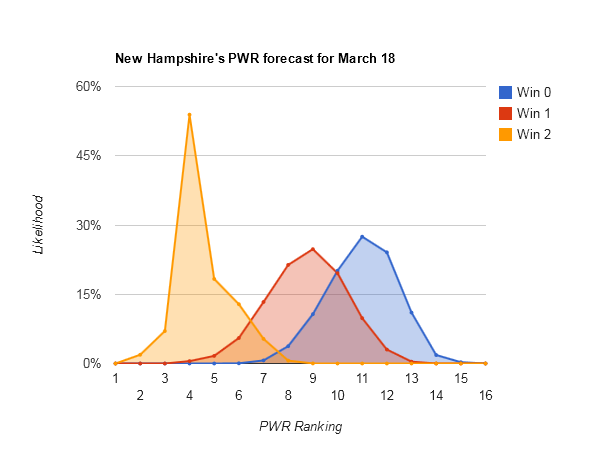
#8 New Hampshire is the first team with serious upside potential. It has a decent RPI and TUC record and is playing a fellow team under consideration, Providence. Most surprisingly, the Wildcats don’t drop much this weekend if they get eliminated (particularly if they win one).

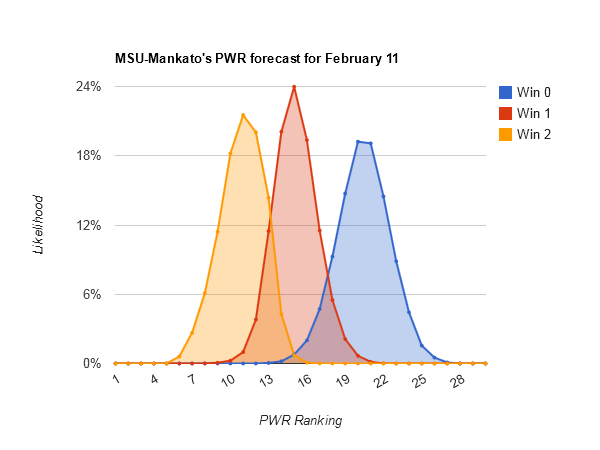
#9 Mankato, #10 Western Michigan, #11 Yale, #12 St Cloud St, and #13 Niagara all have the opportunity to climb with success, or fall to the bubble if eliminated.

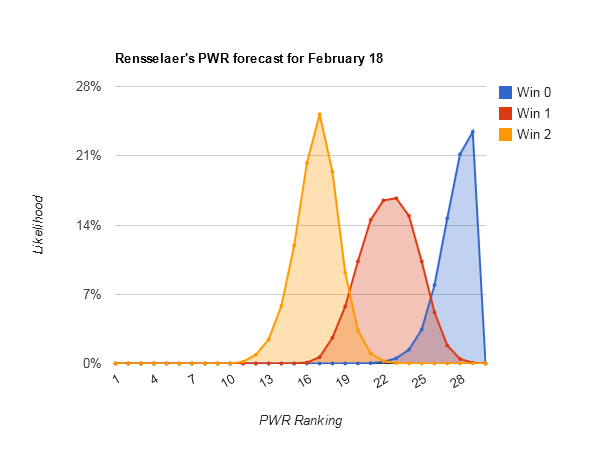
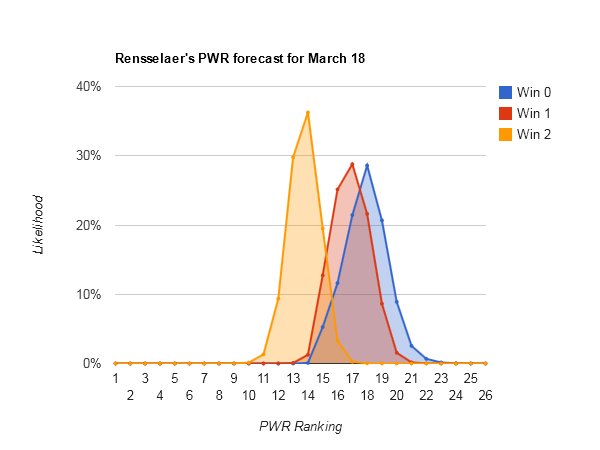
#14 Rensselaer is the highest ranked team that could fall definitively below the bubble if swept.

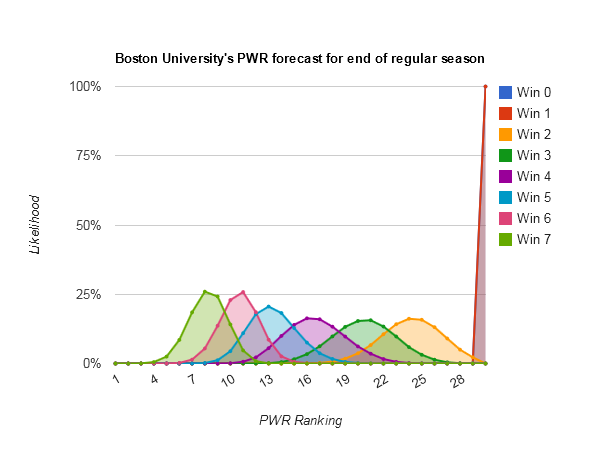
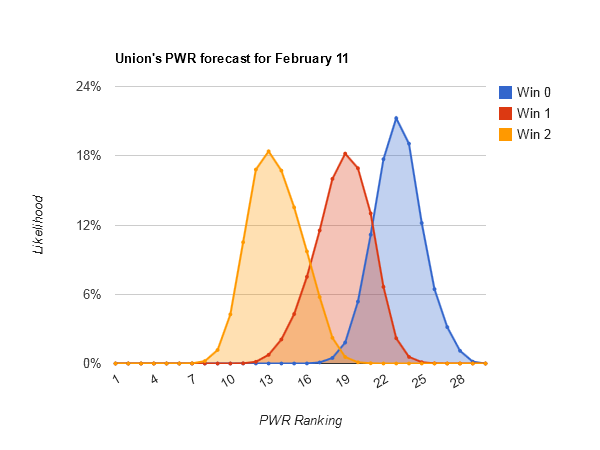
#15 Notre Dame, #16 Union, and #17 Boston University can all push themselves onto the bubble with success this weekend.

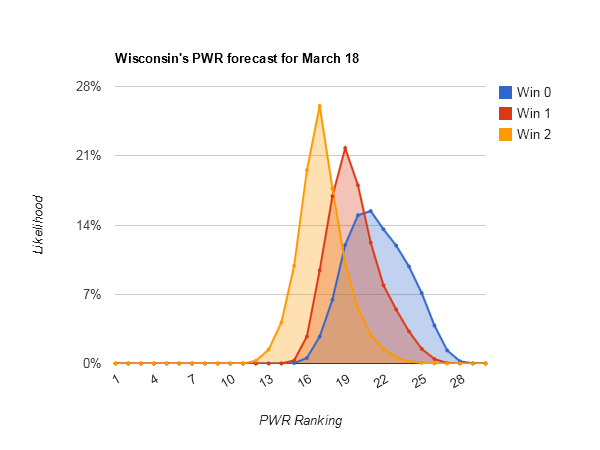
#18 Wisconsin can put itself into a good position but is unlikely to quite climb onto the bubble even with a sweep this weekend.

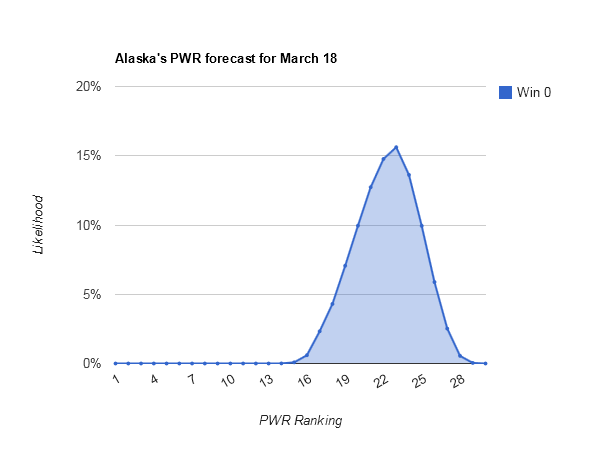
#22 Alaska is the highest ranked team not playing this weekend. Though incredibly unlikely (<1% chance), they could mathematically still climb onto the bubble.

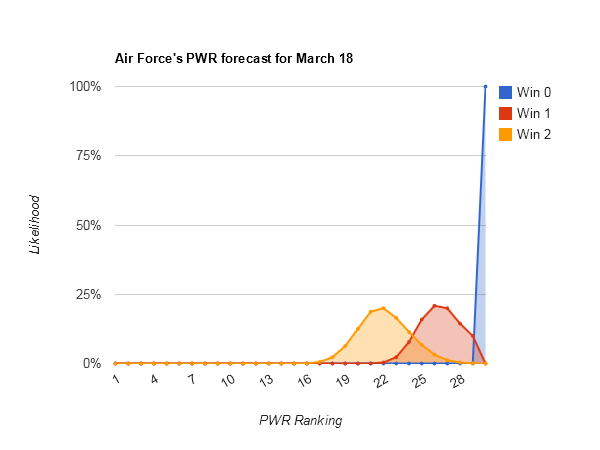
#25 Air Force is the cutoff beyond which even active teams don’t seem to be able to climb onto the bubble through this weekend’s performance alone.

If there’s anything else you’d like to know (e.g. what games are most important for a particular team, what are the chances for a team note listed here), just let me know in the comments!

Methodology

Each forecast is based on at least one million monte carlo simulations of the games in the described period. For each simulation, the PairWise Ranking (PWR) is calculated and the results tallied. The probabilities presented in the forecasts are the share of simulations in which a particular outcome occurred.

The outcome of each game in each simulation is determined by random draw, with the probability of victory for each team set by their relative KRACH ratings. So, if the simulation set included a contest between team A with KRACH 300 and team B with KRACH 100, team A will win the game in very close to 75% of the simulations. I don’t simulate ties or home ice advantage.

Resources

UND needs wins to maintain its lofty ranking

#5 UND has climbed its way back into needing a sweep this weekend just to maintain its current ranking (Current PWR rankings).

Looking at UND’s PWR comparison details, NoDak has very limited upside potential this week. Only the Boston College comparison is obviously within reach, but UND is already ahead of BC in the ranking because of the RPI tie-breaker, so flipping that comparison may not even result in a ranking increase.

UND’s PWR comparisons and RPI details reveal a significant downside, however. The RPI value of winning these games is only .5784, not significantly different enough from UND’s RPI of .5455 to budge it much. The RPI value of losing is .3284, enough to drag down UND’s RPI a fair amount. The PWR comparison details reveal that UND is winning a number of comparisons only by a slim RPI lead (Naigara .5427, Mass.-Lowell .5448, Western Michigan .5384, St Cloud St .5412, and Dartmouth .5216).

Weekend games with the largest effect on UND’s PWR:

Outcome Number of
games
Average effect
on UND’s PWR
North Dakota over Bemidji State (2 of 2) 4.60
North Dakota over Bemidji State (1 of 2) 2.17
Merrimack over Mass.-Lowell (2 of 2) 1.05
Providence over Boston College (2 of 2) 1.05
Merrimack over Mass.-Lowell (1 of 2) 0.93
Air Force over Niagara (2 of 2) 0.92
Air Force over Niagara (1 of 2) 0.73
Alaska Anchorage over Alaska (2 of 2) 0.70

I did a minimum quick update on UND this week because I’m a little late and last week’s UND closes in on NCAA tournament berth was so comprehensive. However, if there’s anything else you’d like to see or any particular questions you have, just let me know!

Methodology

Each forecast is based on at least one million monte carlo simulations of the games in the described period. For each simulation, the PairWise Ranking (PWR) is calculated and the results tallied. The probabilities presented in the forecasts are the share of simulations in which a particular outcome occurred.

The outcome of each game in each simulation is determined by random draw, with the probability of victory for each team set by their relative KRACH ratings. So, if the simulation set included a contest between team A with KRACH 300 and team B with KRACH 100, team A will win the game in very close to 75% of the simulations. I don’t simulate ties or home ice advantage.

Resources

UND closes in on NCAA tournament berth

#6 UND has moved much closer to clinching a tournament berth. Winning at least 2 of the remaining 6 would have UND more likely than not in the top 13 in PWR going into the conference tournaments. Even if UND won only 0 or 1 of its remaining games, an at large berth would still be within reach with a good showing in the conference tournament.

Given the above, UND faces a somewhat predictable situation this week of being able to make a small gain with a sweep over Denver, stay pretty much the same with a split, or fall a bit more if swept.

The final weeks of the regular season

Only three teams can’t fall from being a TUC by the end of the regular season: #1 Quinnipiac, #2 Minnesota, and #3 Miami.

Quinnipiac (PWR Details) is particularly safe, even a catastrophe seems to only drop them 3 spots. Winning only 2 of their remaining 4 would leave them with only about a 10% chance of falling from the #1 spot. Their .7778 vs. TUCs is unassailable, and .5828 RPI is miles ahead of #2 Minnesota .5658. To put that RPI into perspective, if Minnesota swept its final 6 games their RPI would only rise to about .5738 (Minnesota RPI details).

#2 Minnesota and #3 Miami each also have good RPI leads over the teams chasing them, coming in at .5658 and .5529 respectively, with #4 New Hampshire at .5477.

However, #2 Minnesota and #3 Miami aren’t alone in vying for the #2 PWR ranking at the end of the regular season. A staggering 9 teams could claim that position: #2 Minnesota, #3 Miami, #4 New Hampshire, #5 Boston College, #6 North Dakota, #7 MSU-Mankato, #9 St. Cloud St, #11 Denver, and #14 Mass.-Lowell.

Interestingly, the list of teams that can finish top 4 isn’t much longer, add only #8 Western Michigan and #10 Niagara to the list.

The team with the most upside potential for the remaining regular season is #29 Providence, which can climb to #8. That’s mostly just because big upward moves are possible from that low a rank (#28 Colgate and #30 Colorado College could each rise to #14).

The team with the most downside potential for the remaining regular season is #13 Boston University (BU PWR details), which could fall to not being a TUC. #13 BU is only #20 in RPI, and is already losing most of its common opponents comparisons.

Methodology

Each forecast is based on at least one million monte carlo simulations of the games in the described period. For each simulation, the PairWise Ranking (PWR) is calculated and the results tallied. The probabilities presented in the forecasts are the share of simulations in which a particular outcome occurred.

The outcome of each game in each simulation is determined by random draw, with the probability of victory for each team set by their relative KRACH ratings. So, if the simulation set included a contest between team A with KRACH 300 and team B with KRACH 100, team A will win the game in very close to 75% of the simulations. I don’t simulate ties or home ice advantage.

Resources

Small rankings moves likely for UND in bye week

Idle #6 North Dakota could make some small moves in the Pairwise Rankings (PWR) this week, with anything between 5 and 8 being reasonably likely.

Key games for UND

Matchups that most affect UND’s PWR
Matchup Number
of wins
Effect on
UND’s PWR
Ohio State over Western Michigan (1 of 2) 1.13
Ohio State over Western Michigan (2 of 2) 1.05

The reason those games (and others) are important can be deduced by studying the PWR comparison details for UND.

UND’s downside potential

Western Michigan is clearly the bigggest threat this week, with UND currently winning the comparison on the back of a very narrow .5470 to .5454 RPI lead.

Niagara is similarly knocking on the door, losing the comparison to UND only on the basis of Niagara’s RPI of .5381.

Finally, Yale could take the comparison with UND by defeating both Union and Rensselaer, thus raising their TUC record to .5667 (vs. UND’s .5470).

UND’s upside potential

Though New Hampshire is winning the comparison to UND 3-0, two of those criteria would flip to UND if New Hampshire got swept. UND could take both RPI and TUC.

Other interesting teams this week

Smallest range of outcomes — #1 Quinnipiac (#1-#1). Sorry Gopher fans, not this week.

Of the teams that have a two comparison or less deficit with Quinnipiac [Quinnipiac PWR comparisons] (only North Dakota, MSU-Mankato, Niagara, Wisconsin, Providence, Holy Cross, and Robert Morris), none can hope to catch their RPI of .5885 any time soon.

Largest range of outcomes — #23 Rensselaer (#13-#32), #25 Colgate (#13-#32), and #20 Merrimack (#12-#31)

Looking at Rensselaer PWR comparisons, Colgate PWR comparisons, and Merrimack PWR comparisons, all have fairly middling RPIs in the .5100s and quite a few comparisons being decided by RPI. That creates a lot of opportunity for both upward and downward movement from that part of the comparison table.

Most upside potential — #31 Robert Morris (#16–non-TUC)

Robert Morris’s story is simple (Robert Morris PWR comparisons): The TUC criterion hasn’t come into play for them yet because they don’t have 10 games and a sweep this weekend (at least a win seems necessary to stay a TUC) would give them an impressive .700 record vs. TUCs. That would immediately flip a lot of the 1-1 comparisons, and some of the 0-2’s vs teams that Robert Morris can overtake on RPI.

Most downside potential — #14 Dartmouth (#9-#27), #18 Nebraska-Omaha (#17-#31)

Dartmouth is tricky; just looking at Dartmouth’s PWR comparisons, it’s not immediately obvious why #14 Dartmouth has so much more downside potential than #15 Alaska [Alaska PWR comparisons], as RPIs and TUCs are similar. Fortunately, the simulations keep track of which games have the biggest effects on each teams, and there’s a valuable clue there:

Matchups that most affect Dartmouth’s PWR
Matchup Number
of wins
Effect on
Dartmouth’s PWR
Dartmouth over Colgate   5.55
Dartmouth over Cornell   3.94
Brown over Rensselaer   1.56
Brown over Union   1.52
Miami over Notre Dame (2 of 2) 0.98
Lake Superior over Alaska (2 of 2) 0.84
Minnesota over Wisconsin (2 of 2) 0.80
Minnesota over Wisconsin (1 of 2) 0.61
Massachusetts over Mass.-Lowell (1 of 2) 0.58
Lake Superior over Alaska (1 of 2) 0.52
Robert Morris over Niagara (2 of 2) 0.51

The first thing that jumps out is how much Dartmouth wants Brown to win. It turns out that Brown is in danger of not being a TUC, and Dartmouth has 3 wins vs. Brown. Losing those wins would drop Dartmouth’s TUC record from .5333 to .4167. That gives Dartmouth significantly more downside potential with a couple losses than similarly ranked teams with similar RPIs.

Nebraska-Omaha [PWR comparisons], on the other hand, just has a miserable TUC of .3824. Alaska-Anchorage is a weak enough opponent that getting swept would push UNOs RPI from .5196 to about .5086. That would be enough on today’s RPI chart to drop UNO from #17 to #27 in RPI, certainly flipping a lot of comparisons given the poor TUC record. UNO seems to need a sweep not to fall.

Methodology

Each forecast is based on at least one million monte carlo simulations of the games in the described period. For each simulation, the PairWise Ranking (PWR) is calculated and the results tallied. The probabilities presented in the forecasts are the share of simulations in which a particular outcome occurred.

The outcome of each game in each simulation is determined by random draw, with the probability of victory for each team set by their relative KRACH ratings. So, if the simulation set included a contest between team A with KRACH 300 and team B with KRACH 100, team A will win the game in very close to 75% of the simulations. I don’t simulate ties or home ice advantage.

Resources

PWR forecasts for February 11

#10 North Dakota is facing another typical (for it) week of a little bit of upside potential if they sweep, but a fair amount of downside potential if they get swept. (Current PairWise Rankings)

Special Beanpot note — the simulations already include the results of this week’s Beanpot games, but forecast only through next Monday NOT including the Beanpot.

UND’s upside potential comes primarily from two games:

  • If Canisius sweeps Niagara, UND could take the RPI criterion and win the comparion with Niagara
  • If Minnesota sweeps St Cloud, UND could take the RPI criterion and win the comparison with St Cloud

(UND’s pairwise comparisons detailed)

Other teams of interest this week

Note that “likely” outcomes are those with a greater than 1% chance of occurring.

Team with the narrowest spread of likely outcomes: #1 Quinnipiac (#1-#2)

Team with the largest spread of likely outcomes: #19 Union (#9-#28)

Team with the most upside potential: #21 Nebraska-Omaha (#8-#27)

Team with the most downside potential: #12 MSU-Mankato (#7-#25)

Methodology

Each forecast is based on at least one million monte carlo simulations of the games in the described period. For each simulation, the PairWise Ranking (PWR) is calculated and the results tallied. The probabilities presented in the forecasts are the share of simulations in which a particular outcome occurred.

The outcome of each game in each simulation is determined by random draw, with the probability of victory for each team set by their relative KRACH ratings. So, if the simulation set included a contest between team A with KRACH 300 and team B with KRACH 100, team A will win the game in very close to 75% of the simulations. I don’t simulate ties or home ice advantage.

Resources