KRACH predicts the NCAA hockey touranment

Everyone’s favorite college hockey ranking system, KRACH, has the nice feature that it can be used to assign probabilities to potential matchups.

Here’s what KRACH’s forecast for the odds for each team emerging as the winner of each round the NCAA Ice Hockey tournament:

KRACH   Game 1 Game 2
(Region
Champ)
Game 3
(Frozen four
semifinal)
Game 4
(National
Champ)
  West        
100 1. North Dakota 52.74% 28.36% 13.03% 6.89%
89.6042 4. Western Michigan 47.26% 24.12% 10.45% 5.24%
           
84.9926 2. Minnesota 49.43% 23.35% 9.82% 4.79%
86.9526 3. Boston U. 50.57% 24.17% 10.30% 5.09%
           
  Northeast        
154.831 1. Boston College 87.67% 55.51% 35.01% 22.18%
21.7819 4. Air Force 12.33% 2.41% 0.47% 0.09%
           
91.1404 2. Minn. Duluth 50.81% 21.56% 10.81% 5.47%
88.2171 3. Maine 49.19% 20.52% 10.12% 5.03%
           
  East        
71.9621 1. Union 47.27% 21.03% 9.29% 3.72%
80.2812 4. Michigan St 52.73% 24.89% 11.65% 4.97%
           
97.2908 2. Miami (OH) 54.35% 30.47% 15.71% 7.43%
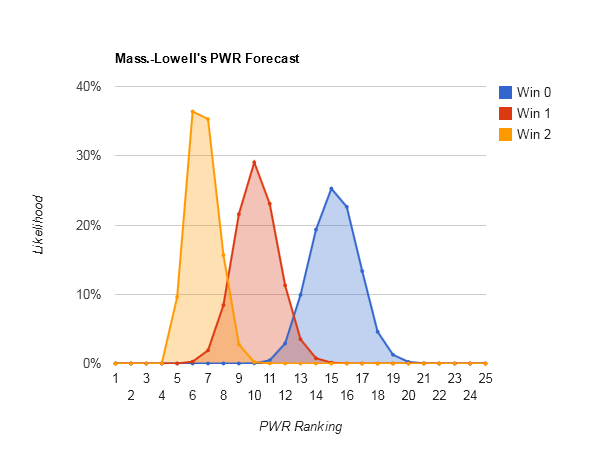
81.7069 3. Mass.-Lowell 45.65% 23.61% 11.16% 4.81%
           
  Midwest        
114.097 1. Michigan 70.06% 39.72% 22.92% 11.74%
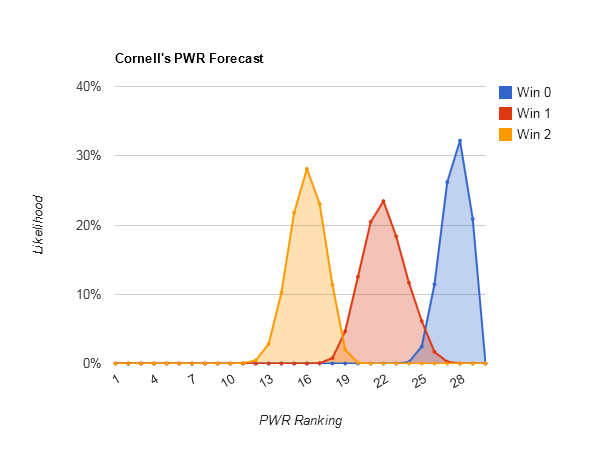
48.7625 4. Cornell 29.94% 10.74% 3.96% 1.24%
           
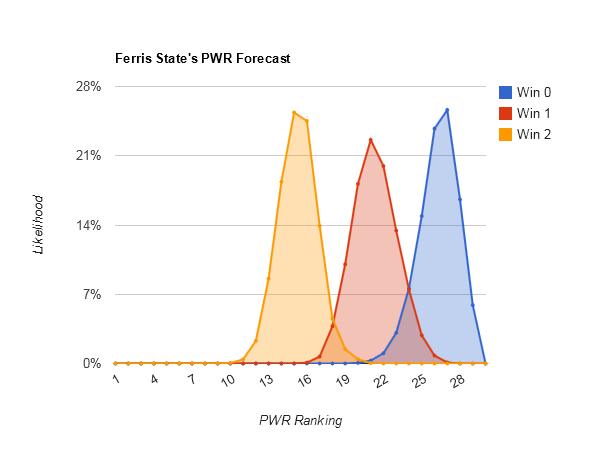
91.2115 2. Ferris St. 52.39% 26.53% 13.84% 6.33%
82.9009 3. Denver 47.61% 23.01% 11.46% 4.98%

A few observations:
* UND’s predicted 53% chance of winning the opening round game is lower than any 1 seed in the previous 4 years I’ve been doing this
* Union is even worse off, not even favored to win its 1 vs 4 matchup
* Similarly, 2 seed Minnesota is an underdog to Boston University
* The largest line in any 2 vs 3 matchup is 54%-46%, Miami over Mass.-Lowell

Friday night final PWR outlook

Again, I can’t stress enough how experimental the “tournament invites” line is.

Here are the PWR possibilities that seem to remain (as always, assuming RPI is the tie-breaker)…

Team PWR Possibilities
Overall If team
wins none
If team
wins all
Boston College 1 100.0%
Tournament invites: 288 (100.0%)
1 100.0% 1 100.0%
Michigan 2 100.0%
Tournament invites: 288 (100.0%)
2 100.0% 2 100.0%
Miami 3 2.4%
4 11.8%
5 11.5%
6 4.9%
7 2.1%
8 17.7%
9 20.8%
10 10.4%
11 11.5%
12 6.9%
Tournament invites: 288 (100.0%)
8 25.5%
9 31.3%
10 15.6%
11 17.2%
12 10.4%
3 7.3%
4 35.4%
5 34.4%
6 14.6%
7 6.3%
8 2.1%
UMD 6 11.5%
7 42.0%
8 36.5%
9 10.1%
Tournament invites: 288 (100.0%)
n/a n/a
Ferris State 4 31.3%
5 38.9%
6 17.7%
7 9.4%
8 2.8%
Tournament invites: 288 (100.0%)
n/a n/a
Boston University 7 2.4%
8 9.7%
9 24.0%
10 33.7%
11 18.4%
12 11.8%
Tournament invites: 288 (100.0%)
n/a n/a
UMN 6 8.0%
7 15.3%
8 26.4%
9 28.1%
10 18.4%
11 3.8%
Tournament invites: 288 (100.0%)
n/a n/a
Maine 3 10.1%
4 8.3%
5 19.1%
6 10.8%
7 1.7%
8 0.0%
9 7.6%
10 17.4%
11 22.2%
12 2.8%
Tournament invites: 288 (100.0%)
9 15.3%
10 34.7%
11 44.4%
12 5.6%
3 20.1%
4 16.7%
5 38.2%
6 21.5%
7 3.5%
UND 3 25.0%
4 25.7%
5 6.9%
6 18.1%
7 19.4%
8 4.9%
Tournament invites: 288 (100.0%)
4 1.4%
5 13.9%
6 36.1%
7 38.9%
8 9.7%
3 50.0%
4 50.0%
Mass.-Lowell 8 0.7%
9 4.5%
10 8.0%
11 11.5%
12 75.3%
Tournament invites: 288 (100.0%)
n/a n/a
Michigan State 13 24.3%
14 24.7%
15 37.5%
16 9.0%
17 4.5%
Tournament invites: 189 (65.6%)
n/a n/a
Western Michigan 13 34.0%
14 41.3%
15 24.7%
Tournament invites: 252 (87.5%)
13 1.4%
14 49.3%
15 49.3%
13 66.7%
14 33.3%
Denver 3 12.5%
4 13.2%
5 11.8%
6 12.5%
7 0.0%
8 0.0%
9 3.5%
10 11.5%
11 31.9%
12 3.1%
Tournament invites: 288 (100.0%)
9 6.9%
10 22.9%
11 63.9%
12 6.3%
3 25.0%
4 26.4%
5 23.6%
6 25.0%
Northern Michigan 14 9.0%
15 32.6%
16 57.6%
17 0.7%
Tournament invites: 73 (25.3%)
n/a n/a
Union 3 50.0%
4 9.7%
5 11.8%
6 16.7%
7 7.6%
8 1.4%
9 1.4%
10 0.7%
11 0.7%
Tournament invites: 288 (100.0%)
4 19.4%
5 23.6%
6 33.3%
7 15.3%
8 2.8%
9 2.8%
10 1.4%
11 1.4%
3 100.0%
Merrimack 15 5.2%
16 33.3%
17 58.0%
18 3.5%
Tournament invites: 14 (4.9%)
n/a n/a
SCSU 23 12.5%
24 54.2%
25 33.3%
Tournament invites: 0 (0.0%)
n/a n/a
Cornell 13 41.7%
14 25.0%
15 0.0%
16 0.0%
17 33.3%
Tournament invites: 192 (66.7%)
13 12.5%
14 37.5%
15 0.0%
16 0.0%
17 50.0%
13 100.0%
Harvard 17 3.5%
18 28.8%
19 26.0%
20 35.1%
21 6.6%
Tournament invites: 144 (50.0%)
19 16.7%
20 70.1%
21 13.2%
17 6.9%
18 57.6%
19 35.4%

Friday night break PWR update

Here’s a quick PairWise Rankings update at the break in action.

At the request of some gentlemen on the USCHO forum I’ve tried adding a probability of making the tournament statistic. It’s based on a combination of the team’s rank and the number of non top 16 autoqualifiers in each scenario. When perfected, it should provide some really useful information, but I just whipped it up this afternoon and it has not been through much quality control so for now should definitely be treated as experimental and not quoted.

Team PWR Possibilities
Overall If team
wins none
If team
wins all
Boston College 1 75.0%
2 25.0%
Tournament invites: 18432 (100.0%)
1 75.0%
2 25.0%
1 75.0%
2 25.0%
Michigan 2 66.0%
3 29.0%
4 4.2%
5 0.8%
Tournament invites: 18432 (100.0%)
2 47.9%
3 37.1%
4 12.5%
5 2.5%
2 75.0%
3 25.0%
Miami 3 0.2%
4 3.0%
5 7.9%
6 9.5%
7 12.6%
8 16.5%
9 14.1%
10 16.6%
11 15.4%
12 4.1%
13 0.2%
Tournament invites: 18432 (100.0%)
7 6.2%
8 19.2%
9 20.5%
10 24.8%
11 23.0%
12 6.1%
13 0.3%
3 0.7%
4 8.9%
5 23.7%
6 28.5%
7 25.5%
8 11.1%
9 1.4%
10 0.3%
UMD 1 25.0%
2 0.0%
3 3.0%
4 7.9%
5 13.4%
6 10.2%
7 19.5%
8 16.0%
9 4.6%
10 0.3%
11 0.0%
Tournament invites: 18432 (100.0%)
5 1.9%
6 17.1%
7 39.0%
8 31.9%
9 9.3%
10 0.7%
11 0.1%
1 100.0%
Ferris State 3 3.4%
4 16.0%
5 32.5%
6 30.8%
7 14.7%
8 2.5%
9 0.1%
Tournament invites: 18432 (100.0%)
n/a n/a
Boston University 2 4.0%
3 20.1%
4 12.8%
5 6.4%
6 3.8%
7 4.6%
8 10.8%
9 16.9%
10 11.7%
11 5.9%
12 2.5%
13 0.4%
Tournament invites: 18432 (100.0%)
7 4.9%
8 20.3%
9 33.7%
10 23.4%
11 11.9%
12 5.1%
13 0.8%
2 16.1%
3 63.7%
4 20.2%
UMN 2 0.6%
3 12.8%
4 11.2%
5 7.4%
6 9.1%
7 13.9%
8 16.3%
9 15.0%
10 9.9%
11 3.5%
12 0.2%
Tournament invites: 18432 (100.0%)
5 0.2%
6 2.6%
7 13.8%
8 27.7%
9 28.5%
10 19.8%
11 6.9%
12 0.5%
2 2.5%
3 47.9%
4 36.7%
5 9.4%
6 2.7%
7 0.9%
Maine 3 2.5%
4 6.3%
5 9.1%
6 4.8%
7 2.3%
8 1.2%
9 4.0%
10 12.6%
11 20.9%
12 24.6%
13 11.2%
14 0.5%
Tournament invites: 18432 (100.0%)
10 0.0%
11 29.7%
12 47.1%
13 22.2%
14 0.9%
3 9.9%
4 25.2%
5 36.5%
6 19.3%
7 9.0%
UND 2 0.7%
3 8.6%
4 13.6%
5 2.8%
6 4.7%
7 7.7%
8 9.2%
9 13.9%
10 20.0%
11 15.6%
12 3.0%
Tournament invites: 18432 (100.0%)
7 1.1%
8 6.6%
9 20.7%
10 35.5%
11 30.3%
12 5.8%
2 2.9%
3 34.5%
4 54.3%
5 8.3%
Mass.-Lowell 6 1.1%
7 4.8%
8 11.8%
9 16.4%
10 13.7%
11 22.2%
12 23.4%
13 6.4%
14 0.3%
Tournament invites: 18432 (100.0%)
n/a n/a
Michigan State 13 9.5%
14 31.3%
15 49.5%
16 4.5%
17 5.3%
Tournament invites: 12560 (68.1%)
n/a n/a
Western Michigan 9 0.0%
10 0.4%
11 3.1%
12 8.4%
13 24.9%
14 39.4%
15 23.9%
Tournament invites: 15698 (85.2%)
13 6.5%
14 45.7%
15 47.8%
9 0.0%
10 0.8%
11 6.2%
12 16.7%
13 43.3%
14 33.0%
Denver 3 2.7%
4 4.7%
5 6.6%
6 8.8%
7 2.0%
8 1.3%
9 3.1%
10 7.8%
11 11.5%
12 29.5%
13 17.1%
14 5.0%
Tournament invites: 18432 (100.0%)
11 1.9%
12 53.9%
13 34.1%
14 10.0%
3 10.9%
4 18.8%
5 26.3%
6 35.0%
7 7.8%
8 1.2%
Northern Michigan 14 2.2%
15 23.3%
16 74.1%
17 0.4%
Tournament invites: 2808 (15.2%)
n/a n/a
Union 2 3.7%
3 17.7%
4 20.0%
5 10.2%
6 9.3%
7 10.1%
8 10.2%
9 10.2%
10 6.6%
11 1.9%
12 0.2%
Tournament invites: 18432 (100.0%)
4 2.1%
5 6.5%
6 13.8%
7 19.2%
8 20.3%
9 20.4%
10 13.3%
11 3.9%
12 0.4%
2 7.3%
3 35.4%
4 37.9%
5 13.8%
6 4.7%
7 0.9%
Merrimack 15 0.6%
16 12.4%
17 74.3%
18 12.7%
Tournament invites: 106 (0.6%)
n/a n/a
SCSU 21 0.7%
22 14.0%
23 44.2%
24 32.7%
25 8.5%
Tournament invites: 0 (0.0%)
n/a n/a
Cornell 4 0.4%
5 2.8%
6 7.9%
7 7.9%
8 4.3%
9 1.6%
10 0.3%
11 0.0%
12 4.2%
13 30.4%
14 21.3%
15 2.6%
16 8.4%
17 8.1%
18 0.0%
Tournament invites: 14908 (80.9%)
13 15.3%
14 27.3%
15 7.7%
16 25.2%
17 24.4%
18 0.0%
4 1.7%
5 11.0%
6 31.4%
7 31.4%
8 17.2%
9 6.3%
10 1.0%
Harvard 15 0.2%
16 0.7%
17 11.8%
18 4.1%
19 31.4%
20 13.9%
21 3.5%
22 1.2%
23 4.1%
24 4.1%
25 9.0%
26 5.9%
27 9.9%
Tournament invites: 4608 (25.0%)
22 0.8%
23 12.1%
24 12.3%
25 27.1%
26 17.8%
27 29.8%
15 0.6%
16 2.8%
17 47.4%
18 16.3%
19 32.9%

Thursday night PWR possibilties update, Sioux seem a lock for NCAAs

The Sioux now seem a lock for the NCAA championship and St. Cloud State’s season is done.

With Mich. Tech and St. Cloud both eliminated, it seems the WCHA can only be won by a team in the top 16, thus only 4 slots can be taken by autobids outside the top 16. So, #12 in the PairWise Rankings should be safe.

Remembering from the Deeper dive into whether UND will make the NCAA tournament that UND can do no worse than #12 after defeating St. Cloud, the Sioux now seem a lock for the NCAA tournament.

Here are the remaining possibilities for the key 19:

Team PWR Possibilities
Overall Win none Win all
Boston College 1 76.0%
2 23.5%
3 0.5%
1 76.3%
2 23.7%
1 76.9%
2 23.1%
Michigan 1 0.3%
2 65.2%
3 27.9%
4 5.0%
5 1.4%
6 0.2%
2 49.4%
3 33.3%
4 12.4%
5 4.3%
6 0.6%
2 75.0%
3 25.0%
Miami 1 0.3%
2 2.7%
3 16.6%
4 15.3%
5 13.0%
6 12.5%
7 10.4%
8 8.6%
9 7.4%
10 7.1%
11 5.0%
12 1.2%
13 0.1%
5 0.1%
6 3.3%
7 13.9%
8 21.0%
9 21.8%
10 21.2%
11 14.9%
12 3.5%
13 0.2%
1 1.2%
2 10.7%
3 56.9%
4 28.1%
5 2.9%
6 0.2%
UMD 1 23.4%
2 2.7%
3 3.0%
4 8.8%
5 13.6%
6 13.0%
7 16.6%
8 13.4%
9 4.6%
10 0.8%
11 0.1%
3 0.0%
4 1.7%
5 8.5%
6 19.7%
7 32.4%
8 26.7%
9 9.1%
10 1.6%
11 0.3%
1 93.6%
2 6.4%
Ferris State 3 5.5%
4 17.6%
5 29.0%
6 28.8%
7 14.9%
8 4.0%
9 0.3%
n/a n/a
Boston University 2 3.1%
3 13.6%
4 10.2%
5 7.3%
6 7.7%
7 10.8%
8 15.3%
9 16.0%
10 10.4%
11 4.4%
12 1.1%
13 0.1%
5 0.0%
6 1.1%
7 10.6%
8 25.5%
9 30.8%
10 20.7%
11 8.7%
12 2.3%
13 0.3%
2 12.5%
3 49.5%
4 29.5%
5 7.3%
6 1.1%
7 0.1%
UMN 2 0.6%
3 12.2%
4 12.2%
5 8.1%
6 7.7%
7 11.9%
8 17.2%
9 17.4%
10 9.7%
11 2.7%
12 0.3%
13 0.0%
5 0.1%
6 2.5%
7 12.0%
8 27.2%
9 32.9%
10 19.3%
11 5.4%
12 0.5%
13 0.0%
2 2.2%
3 45.2%
4 37.3%
5 12.8%
6 1.9%
7 0.5%
8 0.1%
Maine 3 1.0%
4 5.3%
5 8.7%
6 7.5%
7 2.6%
8 1.2%
9 4.9%
10 13.7%
11 24.0%
12 22.9%
13 8.1%
14 0.2%
10 5.9%
11 34.7%
12 42.9%
13 16.1%
14 0.4%
3 3.8%
4 21.2%
5 34.8%
6 29.8%
7 9.9%
8 0.4%
9 0.0%
UND 2 0.5%
3 10.0%
4 10.4%
5 4.3%
6 4.1%
7 7.1%
8 11.0%
9 19.1%
10 20.1%
11 11.6%
12 1.8%
6 0.1%
7 1.8%
8 10.8%
9 27.6%
10 34.4%
11 21.7%
12 3.6%
2 1.9%
3 40.1%
4 41.7%
5 14.5%
6 1.8%
7 0.1%
Mass.-Lowell 6 0.6%
7 3.8%
8 10.6%
9 12.3%
10 17.3%
11 27.8%
12 22.0%
13 5.5%
14 0.1%
n/a n/a
Michigan State 13 11.4%
14 40.7%
15 38.4%
16 4.2%
17 5.3%
n/a n/a
Western Michigan 9 0.0%
10 0.2%
11 1.7%
12 3.7%
13 13.5%
14 33.7%
15 22.6%
16 16.6%
17 8.0%
13 1.2%
14 8.9%
15 16.2%
16 49.8%
17 23.9%
9 0.0%
10 0.7%
11 6.8%
12 14.8%
13 35.5%
14 42.3%
Denver 3 2.1%
4 4.9%
5 7.3%
6 6.6%
7 3.6%
8 1.5%
9 4.1%
10 9.0%
11 11.8%
12 31.0%
13 15.0%
14 3.0%
10 0.0%
11 5.9%
12 58.1%
13 29.8%
14 6.1%
3 8.6%
4 19.7%
5 29.2%
6 26.3%
7 13.9%
8 2.2%
9 0.1%
Northern Michigan 13 1.4%
14 10.4%
15 32.5%
16 55.6%
17 0.1%
n/a n/a
Union 2 1.8%
3 7.6%
4 10.0%
5 6.2%
6 6.8%
7 9.5%
8 10.0%
9 11.4%
10 11.4%
11 7.6%
12 6.1%
13 11.4%
14 0.3%
6 0.0%
7 0.2%
8 1.8%
9 9.3%
10 18.1%
11 17.7%
12 17.8%
13 34.3%
14 0.8%
2 7.1%
3 30.4%
4 38.2%
5 17.5%
6 5.4%
7 1.3%
8 0.1%
Merrimack 14 0.0%
15 1.3%
16 15.6%
17 72.2%
18 11.0%
n/a n/a
SCSU 20 0.0%
21 0.7%
22 13.1%
23 43.9%
24 29.3%
25 11.8%
26 1.3%
n/a n/a
Cornell 4 0.2%
5 1.2%
6 4.6%
7 9.0%
8 7.3%
9 2.5%
10 0.3%
11 3.4%
12 9.8%
13 33.5%
14 11.5%
15 5.2%
16 7.8%
17 3.8%
18 0.0%
12 0.7%
13 24.9%
14 23.9%
15 15.5%
16 23.5%
17 11.5%
18 0.0%
4 0.8%
5 4.7%
6 18.2%
7 35.9%
8 29.2%
9 10.0%
10 1.3%
11 0.0%
Harvard 15 0.0%
16 0.2%
17 10.7%
18 2.9%
19 23.2%
20 13.7%
21 11.7%
22 2.6%
23 4.6%
24 6.7%
25 7.4%
26 8.5%
27 7.8%
28 0.0%
22 1.8%
23 8.8%
24 18.3%
25 22.2%
26 25.6%
27 23.3%
28 0.0%
15 0.1%
16 0.9%
17 42.8%
18 11.4%
19 44.7%

A look at Denver’s NCAA chances

Denver is well-positioned to make the NCAA tournament. Winning a game or two would make it a near certainty, though losing in the opening round would still leave the Pioneers with a better than 50% chance of advancing.

Denver’s possible final PWR
PWR Win 0 Win 1 Win 2 Win 3
1 0.0% 0.0% 0.0% 0.0%
2 0.0% 0.0% 0.0% 0.0%
3 0.0% 0.0% 0.0% 9.5%
4 0.0% 0.0% 0.0% 22.4%
5 0.0% 0.0% 0.0% 31.8%
6 0.0% 0.0% 0.1% 25.4%
7 0.0% 0.0% 1.0% 9.8%
8 0.0% 0.0% 5.1% 1.1%
9 0.0% 0.2% 19.5% 0.0%
10 1.3% 7.3% 39.0% 0.0%
11 12.1% 28.1% 30.2% 0.0%
12 37.3% 41.5% 5.2% 0.0%
13 36.0% 19.2% 0.1% 0.0%
14 13.4% 3.8% 0.0% 0.0%

Because Denver has some potential rankings that are on the bubble, Denver does have an interest in a limited number of conferences being won by teams that won’t be in the top 16. Lists of those are available in previous articles, such as A detailed look at NMU’s chances.

Case-by-case possibilities for Denver’s PWR

Because Denver still have games to play, those are the biggest determinants of Denver’s final ranking.

If Denver makes it to the championship game vs. Minnesota or St. Cloud, the Pioneers will finish at worst #12, good enough to make the NCAA tournament (since the WCHA will be won by a team in the top 16).

Denver PWR if advances to championship game vs. Minnesota or St. Cloud
PWR Lose
Championship
Win
Championship
3 0.00% 7.50%
4 0.00% 20.04%
5 0.00% 31.32%
6 0.07% 27.87%
7 1.28% 11.75%
8 6.47% 1.49%
9 23.29% 0.03%
10 41.14% 0.00%
11 24.77% 0.00%
12 2.99% 0.00%

However, if Denver makes it to the championship game vs. UND, the Pioneers could finish #13 if they lose. Again, the WCHA would be won by a team in the top 16, so the only way #13 would miss is if all the other conferences were won by teams outside the top 16. Though possible, that’s a very unlikely scenario — in outcomes in which the Pioneers face UND in the championship game and lose, about .3% of them leave Denver out of the NCAA tournament.

Denver PWR if advances to championship game vs. UND
PWR Lose
Championship
Win
Championship
3 0 5717
4 0 10894
5 0 12259
6 0 6597
7 17 1397
8 295 0
9 2980 0
10 11967 0
11 17097 0
12 4378 0
13 130 0

If Denver wins its opening game but then loses to Duluth, #12-#14 are distinctly possible. In that scenario, Denver would care most about tournaments being won by teams in the top 16 so #12 and #13 make the tournament. Paradoxically, in terms of final PWR ranking, Denver would be most helped in this situation by St. Cloud St knocking off UND (though there then would be the accompanying risk of SCSU taking the WCHA championship and a slot). Denver is currently holding onto the UND comparison by an RPI thread.

Denver PWR if loses to Minnesota-Duluth
PWR Likelihood
9 0.2%
10 7.3%
11 28.1%
12 41.5%
13 19.2%
14 3.8%

Finally, if Denver loses the opening round, the Pioneers are most likely to finish #12-#14 (as can be seen in the table at the top of this article). In those situations, Denver would again mostly he hoping teams in the top 16 win all the conferences.

There are, otherwise, a lot of combinations that land Denver in the 9-12 range instead of 13-14. Most reliable is Miami defeating Western Michigan and Harvard defeating Cornell.

Denver PWR if loses to Mich. Tech, Miami defeats W. Michigan, and Harvard defeats Cornell
PWR Likelihood
10 2.3%
11 23.3%
12 63.3%
13 11.0%

My apologies for any omissions, this one was a bit rushed to get it out before the games begin!

WCHA Final Five Preview: UND vs. St. Cloud State

After a three-game losing skid at the hands of North Dakota and Minnesota, the St. Cloud State Huskies have found their stride, going 7-2-1 in their last ten games. During that stretch, SCSU grabbed three points against Duluth in a weekend series and swept Wisconsin on the road before securing a home playoff sweep of Nebraska–Omaha to advance to the WCHA Final Five.

North Dakota has been on fire for almost four months. After suffering a 1-0 defeat at the hands of homestanding Bemidji State, UND has gone 18-5-2 to propel itself back into the national playoff picture. Dave Hakstol’s squad has done all this despite being decimated by injuries. The Green and White have regularly skated only eleven forwards, with half of that group consisting of walk-on players and converted defensemen.

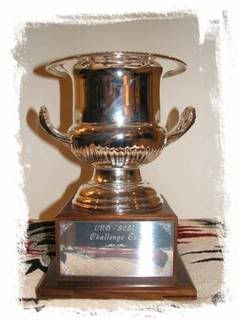
These two teams skated to two splits in the WCHA regular season, with each claiming a share of the UND/SCSU Challenge Cup. Playoff results do not count in the race for the Challenge Cup, but bragging rights and a date with Minnesota in the WCHA semifinals are both on the line Thursday night.

When the 16-team NCAA tournament field is announced on Sunday, expect North Dakota’s name to be called regardless of the results this weekend. St. Cloud State, on the other hand, would need to win the Final Five Championship in order to secure a bid to the national tournament.

UND has won the past two WCHA Final Five championships, defeating St. Cloud State in 2010 and downing Denver in 2011. SCSU’s lone WCHA playoff title came in 2001, when the Huskies defeated North Dakota in overtime.

St. Cloud State Team Profile

Head Coach: (Bob Motzko, 7th season at SCSU, 137-108-34, .552)
Pairwise Ranking: 19th
National Rankings: NR/NR
This Season: 17-16-5 overall, 12-12-4 WCHA (6th)
Last Season: 15-18-5 overall, 11-13 4 WCHA (9th)

Team Offense: 3.13 goals scored/game
Team Defense: 2.63 goals allowed/game
Power Play: 22.5% (31 of 138)
Penalty Kill: 77.9% (106 of 136)

Key Players: Senior F Jared Festler (15-19-34), Junior F Ben Hanowski (22-20-42), Senior F Travis Novak (12-13-25), Freshman D Andrew Prochno (5-23-28), Sophomore D Nick Jensen (6-26-32), Junior G Mike Lee (8-5-2, 2.24 GAA, .930 SV%, 1 SO)

North Dakota Team Profile

Head Coach: Dave Hakstol (8th season at UND, 209-105-30, .651)
Pairwise Ranking: t-11th
National Rankings: #12/#12
This Season: 22-12-3 overall, 16-11-1 WCHA (4th)
Last Season: 32-9-3 overall (NCAA Frozen Four semifinalist), 21-6-1 WCHA (1st)

Team Offense: 3.14 goals scored/game
Team Defense: 2.65 goals allowed/game
Power Play: 21.4% (36 of 168)
Penalty Kill: 81.5% (123 of 151)

Key Players: Junior F Danny Kristo (17-23-40) Junior F Corban Knight (13-22-35), Sophomore F Brock Nelson (23-17-40), Freshman D Nick Mattson (6-12-18), Senior D Ben Blood (3-15-18), Senior G Brad Eidsness (8-3-1, 2.17 GAA, .920 SV%, 1 SO)

By The Numbers

Last Meeting: January 21, 2012 (St. Cloud, MN). One night after the Huskies secured a 3-1 home victory over North Dakota, the Fighting Sioux won a tight 3-2 contest to claim a road split and a share of the UND/SCSU Challenge Cup. UND survived a review of a Ben Hanowski non-goal with under 35 seconds remaining to hold on for the win.

Last Meeting at the WCHA Final Five: March 20, 2010 (St. Paul, MN), UND spotted St. Cloud State a 2-0 lead less than a minute into the hockey game but outscored the Huskies 5-1 the rest of the way en route to a 5-3 victory and the Broadmoor Trophy. North Dakota won three games in three nights to secure the title, becoming just the second team to ever accomplish the feat (Duluth, 2009).

Most Important Meeting: March 17, 2001 (St. Paul, MN). In the game that started the rivalry, St. Cloud State defeated North Dakota 6-5 to claim the 2001 WCHA Final Five Championship. Derek Eastman scored the game-winner in overtime after UND scored three goals in the final ten minutes of regulation to force the extra session.

All-time Series: UND leads the all-time series, 58-31-11 (.635), with a 9-2 (.818) edge in postseason play.

Last Ten: North Dakota is 7-2-1 in the last ten meetings between the schools.

Game News and Notes

North Dakota forward Corban Knight has 14 points in 13 career games against St. Cloud State. UND is appearing in their tenth consecutive WCHA Final Five and are attempting to become the first team in league history to win three consecutive playoff championships. St. Cloud State goaltender Mike Lee stopped 59 of 60 shots he faced last weekend against UNO.Patrick McGovern’s Pub will host all UND pre-game events, beginning two hours prior to any game that UND is playing this weekend.

The Prediction

The Fighting Sioux will be attempting to end another team’s season for the second consecutive weekend. St. Cloud State and UND have had some epic battles in the Final Five, and this one will be no different. The two teams will be tied late, but North Dakota’s top-end talent will make the difference. UND 4, SCSU 3.

Bonus Prediction:

In the earlier Thursday semifinal, Michigan Tech will have the crowd behind them and will jump to an early lead before falling late to the Pioneers of Denver. The four Denver fans in attendance will be quite pleased. DU 4, MTU 2.

A detailed look at NMU’s chances

Assuming all game outcomes are equally likely, Northern Michigan stands something like a 15% chance of making that tournament.

From my previous PWR possibilities article, Northern Michigan’s overall possible final PWR rankings:

Possible PWR outcomes for NMU
PWR Number of
scenarios
Percent of
scenarios
13 15297 1.3%
14 120251 10.2%
15 388264 32.9%
16 610668 51.8%
17 45168 3.8%

Because 13-16 are all on the bubble, it’s most important for Northern Michigan that a limited number of conferences are won by teams that won’t be in the top 16.

Again, those are:

WCHA (2/6)
Michigan Tech
St. Cloud St

Hockey East (1/4)
Providence

ECAC (2/4)
Harvard
Colgate

CCHA (1/4)
Bowling Green

Atlantic Hockey (4/4)
RIT
Niagara
Mercyhurst
Air Force

So, while every conference could conceivably be won by a team not in the top 16, only Atlantic Hockey is guaranteed to be so. So, the last at-large team will be somewhere between PWR 11 and 15. If 3 conferences are won by non-top 16, #13 in the PWR will be in. If 2 conferences are won by non-top 16, #14 PWR will be in. If only AHA is won by a non-top 16, #15 PWR will be in.

Odds of NMU advancing, based on final PWR rank
PWR Odds of NMU
having rank
Odds of
rank advancing
Odds of
rank or
better advancing
Odds of
NMU advancing
via this scenario
15 32.90% 18.75% 18.8% 6.169%
14 10.20% 40.63% 59.4% 6.056%
13 1.30% 30.21% 89.6% 1.165%
12 9.4% 99.0%
11 1.0% 100.0%
Total odds of NMU advancing 13.39%

Note that the odds of each rank advancing assume that each team has an equal shot at winning each game; in other words, they’re actually the share of outcomes in which each rank advances. That table also naively assumes the outcomes that determine NMU’s final PWR are completely independent from the outcomes that determine which PWR ranks advance. That is, of course, not true. But, because none of the scenarios (described below) require unranked teams to advance, it’s a fine rough estimate.

What influences NMU’s final PWR

Because NMU doesn’t have any games remaining, the Wildcats are the mercy of others.

Looking at NMU’s PWR Details, there are two very obvious comparisons that NMU is currently losing but could take (because the comparison is close enough and the other team is still playing):

  • Cornell
  • Western Michigan

It’s also apparently helpful for RIT to defeat Air Force. It’s not immediately obviously why this is the case (both are TUCs over whom NMU is winning the comparison, but so are all the other teams NMU is trying to gain on), but the models say NMU finishes noticeably higher in those scenarios.

A deeper dive into the scenarios

Miami defeating Western Michigan is huge for NMU. Note that it would eliminate a huge number of the #16-17 scenarios, while preserving all of the #13 scenarios and most of the #14 scenarios.

PWR outcomes for NMU if Miami defeats Western Michigan
PWR Number of
scenarios
Percent of
scenarios
13 15297 2.6%
14 102442 17.4%
15 246385 41.8%
16 200993 34.1%
17 24707 4.2%

Western Michigan losing a second game is also pretty helpful. It drops a big majority of the #16-#17 outcomes and about half of the #15. This isn’t completely necessary, in that about 1/3 of the #13 outcomes and about 40% of the #14 outcomes exist outside this scenario, but this is a very attractive scenario for NMU.

PWR outcomes for NMU if Western Michigan also loses the consolation game
  To Michigan   To Bowling Green
PWR Number of
scenarios
Percent of
scenarios
  Number of
scenarios
Percent of
scenarios
13 4992 5.1%   4992 5.1%
14 30630 31.2%   30685 31.2%
15 61242 62.3%   61153 62.2%
16 1440 1.5%   1474 1.5%

Harvard defeating Cornell looks useful for NMU. It eliminates a lot of the 15-17 scenarios while leaving most of the 13-14 scenarios in tact.

PWR outcomes for NMU if Harvard defeats Cornell
PWR Number of
scenarios
Percent of
scenarios
13 15297 2.6%
14 75380 12.8%
15 221000 37.5%
16 257768 43.7%
17 20379 3.5%

However, what’s not obvious from that table is that almost all the good scenarios come about when Cornell loses a 2nd game and almost all the bad scenarios come about when Cornell wins the 2nd game (after losing the 1st).

PWR outcomes for NMU if Cornell also loses the consolation game
  To Union   To Colgate
PWR Number of
scenarios
Percent of
scenarios
  Number of
scenarios
Percent of
scenarios
13 12993 13.2%   2304 2.3%
14 30915 31.4%   29014 29.5%
15 48434 49.3%   66923 68.1%
16 5959 6.1%   63 0.1%
17 3 0.0%      

Note that I haven’t said anything about the RIT/Air Force outcome mentioned above. While it does indeed shift NMU’s chances of a 13-14 up quite a bit, about 2/3 of the #13 scenarios and 3/4 of the #14 scenarios exist outside of this outcome.

PWR outcomes for NMU if RIT defeats Niagara, Air Force defeats Mercyhurst, and RIT defeats Air Force
PWR Number of
scenarios
Percent of
scenarios
13 4942 3.4%
14 30972 21.0%
15 54783 37.2%
16 53420 36.2%
17 3339 2.3%

So, Air Force defeating RIT is a nice outcome for NMU, but by no means necessary.

Too long, didn’t read

Bottom line? NMU’s best shot is for Cornell to lose twice and Western Michigan to lose at least once (though twice is a little better). That scenario includes all of the #13 possibilities, about 1/3 of the #14 possibilities, about 1/5 of the #15 possibilities, and a miniscule chance of being #16.

A deeper dive into whether UND will make the NCAA tournament

If UND wins the WCHA tournament, the Sioux will be ensured an NCAA tournament appearance.

If the Sioux bow out early, they will be at the mercy of their final PWR ranking and the outcomes of other conferences’ tournaments (which will determine how many teams get in on the basis of their PWR ranking).

The good news is that the Sioux are very well positioned, and would miss the NCAA tournament in only a few percent of the remaining possible scenarios. For (much) more detail on what it would take, read on.

How many teams will make the tournament at large?

16 teams total will make the tournament. The winners of each conference tournament are guaranteed a spot, then the remaining spots are filled with the top teams from the PWR Rankings.

So, if only 1 team that’s not in the top 16 wins a conference tournament, the top 15 in the PWR will make it. If 3 teams that aren’t in the top 16 win conference tournaments, the top 13 in PWR will also make it.

Here are the conference tournament participants, with those that could win without climbing to the top 16 in PWR marked.

WCHA
* Michigan Tech
Denver
Minnesota Duluth
* St. Cloud St
North Dakota
Minnesota

Hockey East
Maine
Boston University
* Providence
Boston College

ECAC
* Harvard
Cornell
* Colgate
Union

CCHA
Miami
Western Michigan
* Bowling Green
Michigan

Atlantic Hockey
* RIT
* Niagara
* Mercyhurst
* Air Force

So, the PWR ranking a team needs to make the tournament at large is 16 minus however many conferences are won by teams marked above. 13 is generally a pretty good guess, but it could obviously vary.

If UND loses to St. Cloud

This scenario is, obviously, the one in which UND’s tournament chances are the most threatened.

UND PWR ranking share of outcomes if UND loses to SCSU
7 0%
8 0%
9 7%
10 26%
11 30%
12 28%
13 8%
14 1%
15 0%
16 0%

Fortunately, things still look pretty good for UND, even with this outcome. The odds of UND falling to 13, which is likely to be safe, are only 8%. In only about 1% of scenarios does UND fall to 14.

By far the game that matters most to UND in this scenario is BU defeating Maine.

UND PWR ranking share of outcomes if UND loses to SCSU, by BU/Maine outcome
UND Rank If BU
defeats Maine
If Maine
defeats BU
7 0.0% 0.0%
8 0.2% 0.0%
9 14.6% 0.2%
10 42.3% 8.9%
11 33.5% 27.0%
12 9.0% 46.2%
13 0.5% 16.4%
14 0.0% 1.3%
15 0.0% 0.0%

Other outcomes that would help UND in this scenario include:

  • Michigan Tech over Denver
  • Harvard over Cornell
  • Harvard over Union
  • Colgate over Union
  • Michigan Tech over Minnesota-Duluth
  • Colgate over Cornell

Play with that information a bit in the YATC calculators and you should get a pretty good idea of what UND would need to have happen.

If UND defeats St. Cloud

UND PWR ranking share of outcomes if UND defeats SCSU
5 0.0%
6 0.1%
7 1.9%
8 12.7%
9 32.9%
10 35.8%
11 14.7%
12 1.8%
13 0.0%

This isn’t quite mathematically a lock. #12 can miss the tournament if all 5 conferences are won by a team not in the top 16. Since this scenario requires SCSU to be eliminated, the only remaining WCHA team that could win without being top 16 is Michigan Tech. Providence and Bowling Green are also the only teams capable of winning their conferences without rising into the top 16.

So, it appears that if the Sioux beat SCSU, they can only miss the tournament if Michigan Tech, Providence, and Bowling Green all win their conference tournaments and Harvard or Colgate win the ECAC.

If UND defeats St. Cloud and Minnesota

Given the above, Sioux fans are likely to expect this scenario to be a lock for UND. But, the entire fun of simulating all the outcomes is finding those unexpected niche outcomes.

UND PWR ranking share of outcomes if UND defeats SCSU and Minnesota
PWR UND loses
championship
UND wins
championship
1 0.0% 0.00%
2 0.0% 1.92%
3 0.0% 41.07%
4 0.0% 42.22%
5 2.7% 13.42%
6 15.0% 1.34%
7 25.1% 0.03%
8 25.6% 0.00%
9 21.1% 0.00%
10 9.0% 0.00%
11 1.5% 0.00%
12 0.1% 0.00%
13 0.0% 0.00%

Surprisingly, this isn’t a lock either. Again, #12 can miss in some (very unlikely) scenarios.

However, more Sioux fans who have read this far are probably eying that (still slim) chance of finishing #2 overall.

Resources

NCAA hockey tournament selection / PWR possibilities

With only 19 games to go before the NCAA men’s ice hockey tournament selection, the You are the committee calculators are up and running.

I ran through the 1,179,648 remaining possible outcomes, so you don’t have to. The table below shows the percentage outcomes in which each team ends the season with each rank.

Note that this table does not weight the likelihood of outcomes as I usually do, rather this analysis treats all outcomes as equally likely. I’ll followup later with additional analysis that includes some probabilities, games to watch, and more in-depth analysis of UND’s potential scenarios. As always, drop me any requests if there are other questions you’d like answered.

Team PWR Possibilities
Overall Win none Win all
Boston College 1 79.8%
2 19.8%
3 0.4%
1 81.0%
2 19.0%
1 81.7%
2 18.3%
Michigan 1 0.2%
2 66.8%
3 27.1%
4 4.6%
5 1.1%
6 0.1%
2 51.8%
3 33.3%
4 11.1%
5 3.4%
6 0.4%
2 75.0%
3 25.0%
Miami 1 0.3%
2 2.7%
3 20.2%
4 15.3%
5 12.8%
6 12.6%
7 11.0%
8 9.5%
9 7.2%
10 5.4%
11 2.5%
12 0.5%
13 0.1%
14 0.0%
4 0.0%
5 1.0%
6 8.0%
7 19.4%
8 25.1%
9 21.1%
10 16.3%
11 7.4%
12 1.5%
13 0.2%
14 0.0%
1 1.3%
2 10.7%
3 61.2%
4 24.2%
5 2.5%
6 0.2%
UMD 1 19.7%
2 5.5%
3 5.0%
4 11.6%
5 16.4%
6 17.1%
7 15.1%
8 7.6%
9 1.7%
10 0.2%
11 0.0%
3 1.2%
4 5.9%
5 16.3%
6 28.3%
7 29.2%
8 15.1%
9 3.5%
10 0.4%
11 0.1%
1 78.7%
2 19.8%
3 0.3%
4 1.2%
Ferris State 3 7.7%
4 21.0%
5 30.6%
6 26.5%
7 11.5%
8 2.7%
9 0.2%
10 0.0%
n/a n/a
Boston University 2 2.9%
3 14.9%
4 12.1%
5 8.5%
6 9.9%
7 13.6%
8 15.9%
9 12.9%
10 6.7%
11 2.2%
12 0.4%
13 0.0%
4 0.3%
5 1.9%
6 7.2%
7 18.9%
8 28.1%
9 24.9%
10 13.3%
11 4.5%
12 0.9%
13 0.1%
2 11.6%
3 52.3%
4 29.4%
5 6.0%
6 0.7%
7 0.1%
UMN 2 0.4%
3 9.7%
4 10.8%
5 7.9%
6 8.5%
7 13.6%
8 19.8%
9 19.0%
10 8.4%
11 1.7%
12 0.1%
13 0.0%
4 0.0%
5 0.2%
6 3.0%
7 13.0%
8 29.3%
9 34.1%
10 16.6%
11 3.5%
12 0.2%
13 0.0%
2 1.5%
3 37.4%
4 37.2%
5 17.6%
6 5.1%
7 1.1%
8 0.1%
Maine 3 1.1%
4 6.4%
5 8.7%
6 6.7%
7 2.3%
8 2.6%
9 7.5%
10 13.4%
11 21.8%
12 20.2%
13 8.3%
14 1.1%
10 5.7%
11 36.0%
12 39.5%
13 16.6%
14 2.2%
3 4.5%
4 25.5%
5 34.6%
6 26.8%
7 8.3%
8 0.3%
9 0.0%
UND 2 0.2%
3 5.1%
4 5.3%
5 2.0%
6 2.1%
7 3.6%
8 6.4%
9 14.6%
10 22.9%
11 19.0%
12 14.2%
13 4.2%
14 0.3%
7 0.0%
8 0.1%
9 7.4%
10 25.6%
11 30.2%
12 27.6%
13 8.5%
14 0.6%
2 1.9%
3 41.1%
4 42.2%
5 13.4%
6 1.3%
7 0.0%
Mass.-Lowell 6 1.1%
7 8.8%
8 17.7%
9 19.6%
10 21.6%
11 20.6%
12 8.9%
13 1.5%
14 0.0%
n/a n/a
Michigan State 13 11.7%
14 41.0%
15 37.1%
16 6.6%
17 3.6%
18 0.1%
n/a n/a
Western Michigan 7 0.0%
8 0.0%
9 0.2%
10 1.1%
11 3.1%
12 7.1%
13 13.0%
14 26.6%
15 21.2%
16 19.9%
17 6.4%
18 1.1%
13 0.9%
14 6.6%
15 14.3%
16 55.7%
17 19.2%
18 3.4%
7 0.1%
8 0.1%
9 1.0%
10 4.6%
11 12.5%
12 27.8%
13 32.9%
14 21.1%
Denver 3 1.2%
4 2.8%
5 4.0%
6 3.2%
7 1.3%
8 0.8%
9 2.5%
10 7.3%
11 16.8%
12 29.7%
13 22.8%
14 7.6%
10 1.3%
11 12.1%
12 37.3%
13 36.0%
14 13.4%
3 9.5%
4 22.4%
5 31.8%
6 25.4%
7 9.8%
8 1.1%
9 0.0%
Northern Michigan 13 1.3%
14 10.2%
15 32.9%
16 51.8%
17 3.8%
n/a n/a
Notre Dame 17 4.4%
18 64.6%
19 28.4%
20 2.6%
n/a n/a
Union 2 1.7%
3 7.6%
4 9.9%
5 6.1%
6 5.8%
7 9.0%
8 11.9%
9 13.7%
10 11.1%
11 6.1%
12 7.8%
13 8.2%
14 1.1%
15 0.0%
6 0.0%
7 0.5%
8 4.1%
9 12.3%
10 17.0%
11 14.9%
12 23.2%
13 24.7%
14 3.2%
15 0.1%
2 6.7%
3 30.1%
4 38.3%
5 18.6%
6 5.0%
7 1.1%
8 0.1%
Merrimack 14 0.0%
15 0.8%
16 9.1%
17 64.1%
18 23.0%
19 3.1%
20 0.0%
n/a n/a
Ohio State 19 19.1%
20 48.9%
21 28.7%
22 3.2%
23 0.2%
n/a n/a
Lake Superior 19 0.4%
20 9.2%
21 36.4%
22 40.6%
23 11.6%
24 1.6%
25 0.2%
26 0.0%
n/a n/a
SCSU 13 0.3%
14 1.5%
15 3.7%
16 3.7%
17 3.7%
18 4.6%
19 15.8%
20 13.5%
21 3.4%
22 7.1%
23 22.1%
24 14.6%
25 5.4%
26 0.6%
20 0.0%
21 0.4%
22 14.2%
23 44.3%
24 29.3%
25 10.7%
26 1.2%
13 2.1%
14 12.0%
15 29.5%
16 27.8%
17 25.8%
18 2.9%
Cornell 4 0.3%
5 1.9%
6 6.5%
7 10.2%
8 5.1%
9 1.0%
10 1.7%
11 6.0%
12 11.0%
13 28.6%
14 10.6%
15 4.3%
16 8.9%
17 3.8%
18 0.3%
11 0.0%
12 0.9%
13 23.5%
14 24.1%
15 12.9%
16 26.6%
17 11.3%
18 0.9%
4 1.2%
5 7.5%
6 26.0%
7 40.7%
8 20.2%
9 3.9%
10 0.4%
11 0.0%
CC 19 0.6%
20 5.4%
21 17.0%
22 34.9%
23 31.1%
24 10.3%
25 0.7%
n/a n/a
Northeastern 24 0.0%
25 0.1%
26 3.6%
27 23.8%
28 51.4%
29 19.2%
30 1.8%
n/a n/a
UW 22 0.3%
23 3.8%
24 26.2%
25 42.7%
26 24.3%
27 2.7%
28 0.1%
n/a n/a
Bemidji State 28 9.3%
29 40.3%
30 37.5%
31 11.1%
32 1.7%
33 0.1%
n/a n/a
New Hampshire 30 0.3%
31 18.8%
32 19.4%
33 5.6%
34 0.3%
Non-TUC 55.5%
n/a n/a
Massachusetts Non-TUC 100.0% n/a n/a
Providence 28 0.5%
29 2.9%
30 6.1%
31 9.4%
32 5.0%
33 1.1%
Non-TUC 75.0%
Non-TUC 100.0% 28 1.9%
29 11.6%
30 24.5%
31 37.5%
32 19.9%
33 4.6%
MTech 22 0.0%
23 0.3%
24 1.7%
25 4.3%
26 5.1%
27 1.2%
28 0.0%
29 1.0%
30 4.2%
31 6.1%
32 1.2%
33 0.0%
Non-TUC 75.0%
Non-TUC 100.0% 22 0.0%
23 2.2%
24 13.6%
25 34.1%
26 40.7%
27 9.3%
Harvard 15 0.0%
16 0.1%
17 10.2%
18 3.0%
19 16.5%
20 13.9%
21 11.7%
22 4.9%
23 7.4%
24 7.0%
25 8.6%
26 7.5%
27 8.0%
28 1.1%
20 0.0%
21 0.0%
22 0.8%
23 9.4%
24 18.4%
25 21.6%
26 22.5%
27 24.0%
28 3.2%
15 0.1%
16 0.6%
17 40.6%
18 12.0%
19 41.6%
20 5.1%
Alaska Non-TUC 100.0% n/a n/a
Colgate 17 0.2%
18 3.3%
19 16.0%
20 5.5%
21 0.1%
22 1.3%
23 10.1%
24 23.5%
25 23.3%
26 13.3%
27 2.7%
28 0.8%
24 8.3%
25 41.9%
26 39.4%
27 8.1%
28 2.3%
17 0.6%
18 13.2%
19 64.1%
20 22.1%
Bowling Green Non-TUC 100.0% Non-TUC 100.0% Non-TUC 100.0%
Nebraska-Omaha Non-TUC 100.0% n/a n/a
Quinnipiac 25 5.7%
26 35.8%
27 45.6%
28 10.8%
29 2.1%
n/a n/a
Yale Non-TUC 100.0% n/a n/a
St. Lawrence Non-TUC 100.0% n/a n/a
Niagara 22 1.2%
23 3.7%
24 6.1%
25 2.9%
26 2.6%
27 6.0%
28 13.6%
29 14.6%
30 18.5%
31 19.5%
32 9.8%
33 1.5%
34 0.1%
28 3.2%
29 11.1%
30 27.4%
31 35.7%
32 19.6%
33 3.0%
34 0.1%
22 4.9%
23 14.6%
24 24.2%
25 11.4%
26 10.0%
27 16.2%
28 10.7%
29 7.0%
30 0.4%
31 0.5%
Mankato Non-TUC 100.0% n/a n/a
Air Force 19 0.0%
20 0.7%
21 2.5%
22 5.7%
23 8.8%
24 6.1%
25 1.1%
26 1.4%
27 2.0%
28 11.4%
29 19.9%
30 26.0%
31 11.5%
32 2.6%
33 0.2%
26 0.0%
27 0.1%
28 1.2%
29 20.7%
30 49.5%
31 23.1%
32 5.2%
33 0.3%
19 0.1%
20 2.9%
21 10.0%
22 22.7%
23 35.2%
24 24.6%
25 4.5%
Clarkson Non-TUC 100.0% n/a n/a
Dartmouth Non-TUC 100.0% n/a n/a
RIT 20 0.2%
21 0.2%
22 0.9%
23 1.0%
24 2.9%
25 5.1%
26 5.8%
27 8.0%
28 1.0%
29 0.1%
30 5.6%
31 10.2%
32 7.0%
33 2.0%
34 0.1%
Non-TUC 50.0%
Non-TUC 100.0% 20 0.7%
21 0.9%
22 3.4%
23 3.9%
24 11.5%
25 20.3%
26 23.2%
27 32.0%
28 4.0%
AA Non-TUC 100.0% n/a n/a
Princeton Non-TUC 100.0% n/a n/a
Mercyhurst Non-TUC 100.0% Non-TUC 100.0% Non-TUC 100.0%
Rensselaer Non-TUC 100.0% n/a n/a
Holy Cross Non-TUC 100.0% n/a n/a
Vermont Non-TUC 100.0% n/a n/a
Brown Non-TUC 100.0% n/a n/a
Robert Morris Non-TUC 100.0% n/a n/a
Bentley Non-TUC 100.0% n/a n/a
Connecticut Non-TUC 100.0% n/a n/a
Canisius Non-TUC 100.0% n/a n/a
Alabama-Huntsville Non-TUC 100.0% n/a n/a
American Int’l Non-TUC 100.0% n/a n/a
Army Non-TUC 100.0% n/a n/a
Sacred Heart Non-TUC 100.0% n/a n/a

This is the last time I’ll post the complete table, from now on I’ll just focus on those teams that can still finish in the top 16.

Resources

WCHA Playoff Preview: UND vs. Bemidji State

November 20, 2011. Bemidji State 1, North Dakota 0.

The last time these two teams met, the Beavers held on for their first victory over UND since 1970 (and second overall). Dan Bakala made 26 saves for BSU and North Dakota fell to 2-6-0 in conference play with the loss.

But Bemidji State hasn’t only been getting it done with great goaltending and tight, low-scoring games. Since November 20th, the Beavers have scored 4 or more goals seven times and compiled a record of 13-8-2. On the flip side, however, Tom Serratore’s squad has given up 4 or more goals eight times.

I’m not certain that BSU would like to play racehorse hockey with North Dakota. Since that November night, the Green and White have notched 4 or more goals twelve times and allowed that number only five times while boasting a record of 16-5-2.

Dave Hakstol’s squad continues to run short, with only eleven “forwards” each night. I use quotation marks because Dan Senkbeil and Joe Gleason are playing up front after beginning the season as defensemen.

Last season (Bemidji’s first in the WCHA), the Beavers advanced to the Final Five, securing a road sweep of Nebraska-Omaha in the first round and dispatching Minnesota-Duluth in the quarterfinals before falling to Denver 6-2 in the semifinals.

North Dakota has hosted the first round of the WCHA playoffs for ten consecutive seasons, a league record. UND is seeking its tenth straight berth in the Final Five, which would also extend the longest active streak in the conference. Minnesota made 11 consecutive Final Five appearances between 1999-2009 and ten consecutive appearances from 1988-1997.

This series marks the first time North Dakota and Bemidji State have ever met in the playoffs. Bemidji will need to win the WCHA Final Five to advance to the NCAA tournament this season, while UND would be squarely on the tournament bubble with a series loss. Any result in which UND advances to St. Paul for the WCHA Final Five would land the Fighting Sioux in fairly safe territory for the NCAA’s.

Bemidji State Team Profile

Head Coach: Tom Serratore (11th season at BSU, 195-162-41 .541)
Pairwise Ranking: t-27th
National Rankings: NR/NR
This Season: 17-16-3 overal, 11-14-3 WCHA (9th)
Last Season: 15-18-5 overall, 8-15-5 WCHA (t-9th)

Team Offense: 2.69 goals scored/game
Team Defense: 2.81 goals allowed/game
Power Play: 21.2% (24 of 13)
Penalty Kill: 84.4% (119 of 141)

Key Players: Junior F Jordan George (18-12-30), Senior F Shea Walters (12-13-25), Senior F Ben Kinne (10-11-21), Senior D Brad Hunt (5-19-24), Freshman D Matt Prapavessis (1-12-13), Senior G Dan Bakala (11-11-2, 2.57 GAA, .914 SV%, 1 SO)

North Dakota Team Profile

Head Coach: Dave Hakstol (8th season at UND, 205-105-30, .647)
Pairwise Ranking: t-12th
National Rankings: #12/#12
This Season: 20-12-3 overall, 16-11-1 WCHA (4th)
Last Season: 32-9-3 overall (NCAA Frozen Four semifinalist), 21-6-1 WCHA (1st)

Team Offense: 3.09 goals scored/game
Team Defense: 2.69 goals allowed/game
Power Play: 21.0% (34 of 162)
Penalty Kill: 81.5% (119 of 146)

Key Players: Junior F Danny Kristo (17-23-40) Junior F Corban Knight (12-22-34), Sophomore F Brock Nelson (23-16-39), Freshman D Nick Mattson (6-12-18), Senior D Ben Blood (2-15-17), Senior G Brad Eidsness (7-3-1, 2.09 GAA, .923 SV%, 1 SO)

By The Numbers

Last Meeting: November 20, 2011 (Bemidji, MN). A scoreless game turned in the third period when North Dakota’s Andrew MacWilliam and Mark MacMillan were penalized on the same play. 72 seconds into the ensuing 5 on 3 advantage, BSU’s Jordan George banged home a loose rebound and the Beavers held on for the 1-0 victory. It was Bemidji State’s first victory over UND in over 40 years.

Last Meeting in Grand Forks: February 27, 2011. Four of the six seniors in the lineup scored a goal as the homestanding Sioux wrapped up a four game season sweep of the Beavers. UND won the Sunday afternoon contest 5-1 after downing BSU 5-2 on Saturday afternoon.

Most Important Meeting: October 15, 2010 (Bemidji, MN). In the first game played at the BREC, North Dakota spotted BSU the opening goal less than two minutes into the contest and then steamrolled the Beavers 5-2. The Fighting Sioux outshot their fellow Green-and-Whiters 38-14.

Last Ten: North Dakota has won nine of the last ten meetings between the teams, outscoring BSU 39-17 during that stretch. One of those UND victories was a 4-3 overtime decision in Grand Forks, while Bemidji State’s lone bright spot was a 1-0 home win earlier this season.

All-time Series: UND leads the all-time series, 22-2-1 (.900), including a 14-1-1 (.906) record in games played in Grand Forks. The two teams have never met in the postseason.

Game News and Notes:

Under head coach Dave Hakstol, North Dakota is 14-3 in the first round of the WCHA playoffs and have yet to lose an opening round series. BSU head coach Tom Serratore will coach in his 400th career game on Saturday night and is five wins short of 200 for his career. Sioux sophomore forward Brock Nelson won the league scoring title with 20 goals in conference action.

The Prediction

It’s always difficult to end a team’s season, and that’s the task North Dakota is faced with this weekend. I have a feeling that the Beavers will attempt to play an up-tempo style in Friday’s opener and lock things down in Saturday’s rematch. This series may go to Sunday, but I’ve got UND in two, with Saturday’s series finale going to overtime. UND 5-2, 3-2 (OT).