Forecasting the PWR… a look ahead at SCSU

Though the Sioux continue to complicate things with ties, I’m again going to declare reasonable success in last week’s prediction.  A split was predicted to most likely land UND in the 14-17 range and a sweep in the 11-14 range.  3 points on the weekend left UND at 14-15.

So, without further ado, this week’s forecast:

UND's PWR on 2009-Feb-01 based on outcomes vs. St. Cloud

Help for those who don’t like reading graphs:

Sioux sweep: 67% chance of landing at #12 or #13, 94% chance of landing between #11-#14.

Split: 77% chance of landing #14 or #15

Sioux swept: 60% chance of landing #17 or #18, 91% chance of landing between #16-#19.

Who else to cheer for?

Of teams playing just 1 game:

Vermont win over New Hampshire gives UND an average rise of .472

Of teams playing 2 games:

A Bemidji St sweep over Bob Morris gives UND an average rise of .607 (a single win gives UND a rise of .277)
An Alaska sweep over Ohio State gives UND an average rise of .518 (a single win gives UND a rise of .247)

End of season outlook

Last but not least, there’s been a lot of speculation how many games UND needs to win to make the tournament. For the regular season only, here’s UND likely PWR ranking based on how many of its remaining games it wins. To be comfortably ranked higher than 13 would require winning 80%, though it’s a tossup at 60%, and still possible at 50%.

UND's forecasted end of regular season PWR based on win% over remaining games

Predicting the PWR… The impact of the Denver series

Last week’s A look into the future… UND’s PWR after the Michigan Tech series went pretty well.  If you look back at the chart, UND was most likely to fall between 15 and 17 with a sweep and 20 to 21 with a split.  Here we are, a 3-point series later, and UND’s PWR is currently 16 (it fluctuated from 14 to 16 after UND’s game were finished, based on other teams’ results).

A look at how the Denver games will affect PWR

And you thought the PWR was volatile the last couple weekends.  Get a load of this…

postdupwr
UND's likely PWR based on this weekend's outcomes

For a quick lesson or reminder how to read the chart:

The three lines represent the potential PWR rankings as of next Monday (Jan. 26) dependent on UND’s performance this weekend.  The far left purple line is UND sweeping, the middle orange line a split, and the right blue line DU sweeping.  The numbers on the bottom are the possible PWR ratings and the numbers on the left axis the likelihood of that ranking.

For example, looking at the high point of the purple line, it’s at about 30% for both 12 and 13.  That means that if UND sweeps Denver, there’s over a 30% chance its PWR will be 12 and over a 30% chance its PWR will be 13 (or over a 60% chance its PWR will be either 12 or 13).

Average increase in UND’s PWR from 1 win this weekend: 5.76 spots
Average increase in UND’s PWR from 2 wins this weekend: 8.50 spots

Other games of interest

One of the reasons predicting PWR is so tricky is that UND’s PWR is influenced by other games as its former and future opponents rise and fall. This week I also recorded which non-UND games have the biggest impact on UND’s PWR as of next Monday.

Team Average UND PWR
if team wins 0
Average UND PWR
if team wins 2
Average Gain
in UND PWR
from team sweep
Northern Michigan
over Alaska
16.53 15.16 1.37
Bemidji State
over Niagara
16.56 15.30 1.26
SCSU
over CC
16.84 15.64 1.20

So, Northern Michigan is the non-UND game that has the biggest impact on UND’s PWR (as of next Monday). If Northern Michigan sweeps Alaska, UND’s PWR will be an average of 1.37 spots higher. To help rationalize why, lets take a look at UND’s current PWR comparisons. The Sioux lose to Alaska 1-2 based on an RPI difference of just .0001; a Northern Michigan sweep almost certainly flips that comparison, explaining most of the jump. You can dig into the others yourself, or trust the computer and cheer for the Beavers and Huskies 😉

A look into the future… UND’s PWR after the Michigan Tech series

Did you know that the PWR table shows you the movement since last week? The little arrow (green, pointing up next to UND) shows you the direction of the move, and the text shows the magnitude. UND climbed 6 spots, from 23 to 17, by sweeping the Gophers.

pwr20090112

Wow, who saw that coming? That gave me an idea that I think might be the first really good use of the PWR Predictor. A question I’m certainly asking myself now, and I’m sure I’m not alone, is:

What will UND’s PWR be next Tuesday if UND sweeps Tech? What if Tech sweeps the Sioux?

Well, here we go…

Probability of UND’s PWR as of Jan. 20, based on how it performs vs. Michigan Tech:

20090119

UND’s current PWR is 17

Here’s what the chart is telling you UND’s PWR will be:

  • UND sweeps: 68% chance it’s between 15 and 17, about a 4% chance its 13 or higher, about a 4% chance it’s 19 or lower
  • Split: 75% chance it’s between 19 and 22, about a 1% chance its 16 or higher, about a 2% chance it’s 2 or lower
  • Tech sweeps: 50% chance UND falls out of being a TUC, 42% chance it’s between 22 and 25

Future directions

I think the chart above is a good one that is easily understood and conveys interesting information. It (or a refinement of it) is likely to be the first one that I turn into a real product — a web page that automatically updates that anyone can visit to find out this sort of information each week.

Obviously, it would be nice to be able to drill in and find out what else could happen around the league to influence where UND falls in those distributions. E.g., what else has to happen, combined with a UND sweep, for UND to jump to 9th (or fall to 23rd) in the PWR. Figuring out how to make that information accessible to interested parties is definitely something I’ll also add to the to-do list for future features of this product.

I’m still running lots of simulations and making charts, trying to find useful simulations and ways to present the results.

Background

Those wondering where these predictions come from, or interested in other presentations of PWR prediction data, should read the previous blog posts in which I introduced the PWR Predictor:

More on the PWR predictor

Last week’s post, Swept at the GLI — how harmful to PWR?, introduced the idea of simulating the remaining season to predict the PWR and led to a lot of speculation about exactly what it would take for the Sioux to reach the NCAA tournament.

I’ll start with that last point — in simulations that have UND reach the top 12 in PWR, UND wins about 75% of its 16 remaining regular season games.  That winning 75% of remaining games could land UND in the tournament is notably less pessimistic than most of the non-data based speculation I’ve seen, so wanted to get that out there.  Further, the WCHA tournament could add up to 6 additional games to UND’s pre-NCAA tournament schedule, giving UND additional opportunities to climb in the PWR.  In short, it’s very possible for UND to make the NCAA tournament with a reasonable run of good performance.

This stuff is very new and I’m still trying to figure out how to make it more usable and accessible to non-stats geeks, so if that’s you, jump to “What’s next” for a preview of those efforts.

Now it gets a little denser…

In noting last week that each weekend’s pair of games would knock out 3/4 of the remaining possible outcomes, I was concerned that the potential outcomes eliminated would be so biased as to make this exercise somewhat useless.  That is, I wondered if a sweep would remove 3/4 of the bad outcomes, increasing the probability of good outcomes by 4x.  A tool that predicted a 10% chance of a certain PWR before playing Bemidji St and a 40% chance of that same PWR after a sweep would be useless indeed.  Fortunately, that wasn’t the case.

The predicted PWR outcomes based on Bradley/Terry (KRACH)-determined game outcomes made only a minor shift, as intuitively follows UND’s predicted 60% chance of winning each game.

Probability of UND's end-of-season PWR using KRACH to predict game outcomes
Cumulative probability of UND's end-of-season PWR using KRACH to predict game outcomes

A quick note on how to use KRACH to predict game outcomes: going into the Gopher series, UND’s KRACH is 100 vs UMN’s 252 (other sites may have other numbers, but the ratio should be about 1:2.5).  Therefore, UMN stands a 2.5x greater chance than UND of winning each game.  Restated, if they perform as they have to date, UND is predicted to have about a 28% chance of winning each game.  These games are the least likely remaining wins on UND’s schedule, so wins this weekend would definitely shift the remaining possibilities and give us some very useful insight into this tool.  So, let’s see ’em boys 🙂

What’s next?

I already noted that in simulations in which UND reaches top 12 in PWR, UND wins about 75% of its 16 remaining regular season games. However, what I think people really want to know is: What is the likelihood of UND making the tournament if its wins 75% of its remaining games?  (or 50%, or 90%?)

I think that will be the most useful way to look at these results — probability distributions of likely PWRs given a particular winning percentage.  e.g. a graph that shows that if UND wins 75% of its remaining games, it stands a 10% chance of being ranked 11, an 11.3% chance of being ranked 12, etc…

Swept at the GLI — how harmful to PWR?

People who follow the PWR (PairWise Rankings) now know intuitively that getting swept at the GLI was particularly harmful to UND’s PWR (and NCAA tournament) chances, but for the first time ever anywhere, we can try to quantify how harmful.

The surprising bottom line — UND’s chances of getting a top 15 ranking in the PWR are now only about 1/3 to 1/4 what they would have been if UND had instead swept this tournament.

Without further ado, as simulated by the new PairWise Ranking Predictor, here are the distributions of UNDs PWR chances with the actual outcome of the Great Lakes Invitational vs if UND had swept.

krach

Using KRACH to predict the outcomes of unfinished games, UND now stands under a 5% chance of ending the regular season in the top 15 of the PWR.  Had UND swept the GLI, the Sioux would have instead stood over a 20% chance.

A few words about the chart — the horizontal axis is the desired PWR ranking (1 good, 25 bad), the vertical axis is the cumulative probability of achieving the corresponding PWR ranking, the green line represents UND’s actual chances as of today, the blue line what UND’s chances would have been with a sweep.  Note that the KRACH probabilities used to predict the outcomes of remaining games are the same for both — the current KRACH ratings that incorporate being swept.

But wait, Jim, you say… using KRACH to predict the probabilities just extends how teams have performed to date through the end of the season.  The mid-season KRACH last year would have also predicted doom and gloom for the Sioux.  While that’s true, I’m using these predictions to point out how much the differential, how much the sweep hurt, not the actual levels (e.g. 5% chance of finishing top 15).  Nonetheless, another interesting way to look at it is what proportion of the possible remaining outcomes land the Sioux in each PWR ranking.  That can be somewhat answered with a similar simulation that makes the outcomes of each game random (50% win, 50% lose) rather than with probabilities determined by KRACH.

random

Though a random draw looks better for the Sioux than the KRACH predictions, UND’s chances of a top 15 PWR were harmed even more from comprising 50% of possible remaining scenarios to 15%.  Note further that the number of potential outcomes that even land the Sioux as a TUC fell from nearly 80% to 50%.

A few extra notes for the geeks — the simulations were Monte Carlos with 1,000,000 trials per scenario.  While I didn’t do formal sensitivity analysis, a few runs of one demonstrated that results for each potential ranking were generally within .001%, so I’m pretty happy with 1,000,000 trials.

How deep a hole? A look back at past seasons.

Another slow start for the Sioux hockey team has led to inevitable comparisons with years past. But there’s a feeling among some that key losses have led to a deeper hole this year that will be more difficult to climb out of with a second half surge.

2008 start vs past seasons

Season PWR RPI Win% KRACH Out of
Conference
Games
2008-12-08 n/a #26 (.5124) .4688 #22 L – Boston Univ.
L – Massachusetts
W/L – Cornell
W/W – Harvard
2007-12-10 #7 #8 (.5689) .5667 #6 W – Michigan St.
T – Boston Coll.
W – Northeastern
End of 07-08
reg. season
#4 .5866 .7143
2006-12-11 #20 #22 (.5251) .4688 #13 W/W – Quinnipiac
L/L – Maine
End of 06-07
reg. season
#6 .5497 .5972
2005-12-12 #17 #15 (.5327) .5833 #13 W – Miami
L – Michigan St.
W/W – Northeastern
W/T – New Hampshire
End of 05-06
reg. season
#12 .5475 .6220

This seems to be UND’s worst start in the past four years. The Sioux have a win% equal to the previous low for this point in a season — 2006-07. UND’s RPI this year is lower than it was 2006-07, and KRACH rates the Sioux as a significantly less competitive team than they were at this point that season.

However, that season did include two early losses vs. Hockey East (both to Maine), and a PWR ranking of #20 at this point in this season. The Sioux rallied by the end of that regular season to finish #6 in the PWR, demonstrating that it is possible to climb out from such a hole.

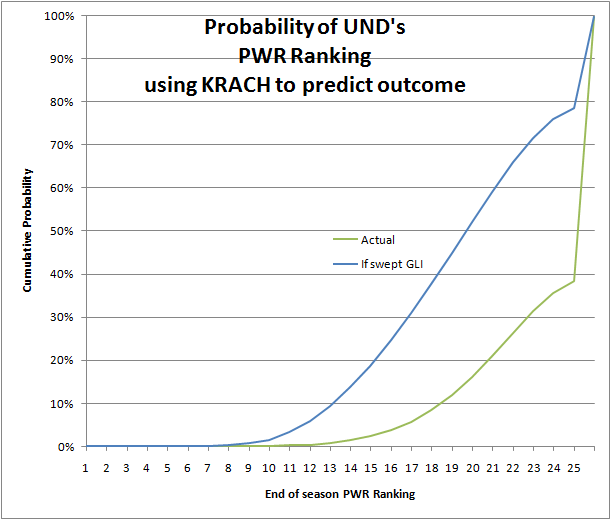
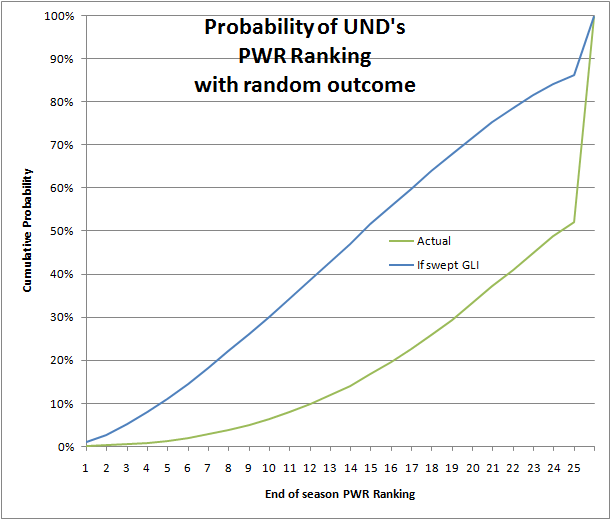
Chart of UND’s 2006-07 PWR comeback

Can the Sioux still make the NCAA tournament?

In short, yes. Over half the season remains to be played! The rest of this post will look at the impact of the season to date on contributors to the PWR and future opportunities to influence contributors to the PWR. It is not meant to encourage anyone to worry much about UND’s current position in the PWR, which is quite meaningless.

Winning percentage

As an upper bound to the potential for a turnaround, consider Spring of 2008 in which the Sioux posted an amazing 18 game undefeated streak, never losing from January 5 until the playoffs. Taking the 2007-08 record over their last 22 games (16-3-3) and adding it to this year’s tally (7-8-1) would result in a final record of 23-11-4.

That would give the Sioux a regular season win percentage of .6579.

RPI

Assuming UND’s past and future opponents remain of constant quality until the end of the season, UND’s RPI from a win percentage of .6579 should be about .56. That would place UND at #11 on the current RPI chart. See other RPI scenarios under “Future RPI” on the North Dakota Hockey RPI Details page. If, instead, UND won about 13 of its remaining 21 games*, it would end the season with a win percentage of .5541 and an RPI of about .5356, currently good for 20th in the NCAA.

*That page shows only 21 remaining games for UND, though there will certainly be a 22nd, because the second opponent for the Great Lakes Invitational is not yet known.

PWR components

If the season ended today, UND wouldn’t be a TUC because it’s not in the top 25 of RPI, so would not be ranked in the PWR.

Current record vs. TUCs: 4-7-1
Remaining games vs. current TUCs: 14 (Minnesota 2, Denver 2, St Cloud St 4, Wisconsin 2, Colorado College 2, Mankato 2)

UND’s non-conference losses to Hockey East teams will hurt its COP comparisons to Hockey East teams, though UND has ample opportunity to shore up its COP comparisons to Western teams. UND has a large part of its WCHA schedule ahead of it; the Great Lakes Invititational (including Michigan St. and potentially Michigan) will position UND vs. the CCHA.

If UND averaged .600 for the rest of the season (RPI of about .5356 #20), it would result in a TUC of 12-13-1 (if that percentage is applied across TUCs); .800 (RPI of about .56 #11), would result in a TUC of 15-10-1 (ceteris paribus), and position UND well for H2H and COP comparisons with WCHA teams.

Tournaments

Of course, UND’s opportunities don’t end with the regular season. Every team in the WCHA gets at least two WCHA Final Five play-in games. All-in-all, the Final Five could add up to six games to UND’s schedule. Finally, winning the tournament would guarantee an NCAA tournament berth, regardless of previous performance.

A need to get defensive?

There’s been a lot of chatter about the perceived decline of the UND defense and when it began. Though stats don’t tell the whole story — each season includes a different set of opponents, and the team plays to win the game not to beat the stats — they’re an interesting place to start. Thanks to UND92,96 in the forum for doing the legwork, here are this year’s defensive stats compared to the past few years.

Year YPG PPG
2000 217 ypg 13.3 ppg
2001 191 ypg 13.0 ppg
2002 276 ypg 19.2 ppg
2003 304 ypg 19.3 ppg
2004 250 ypg 10.5 ppg
2005 262 ypg 13.0 ppg
2006 314 ypg 17.9 ppg
2007 320 ypg 19.7 ppg
2008 368 ypg 25.3 ppg

Regular-season only.

What’s the importance of opening losses?

As is to be expected, there’s much teeth-gnashing in Sioux fandom about an unusual season-opening two losses.  The most valid concern is what those games revealed about the talent and potential of the team for the rest of the season.  I’ll leave that question to more qualified commentators and the forum denizens (a lot of whom are also more qualified than I).

Instead, I found myself wondering what the actual impact of these two losses would be, all other things being equal, on the PairWise Ranking (PWR) used to seed the NCAA tournament.  College hockey has a pretty long season, which reduces the importance of any individual game, but PWR can make inter-conference matchups unusually important.

Opening 2007-08 with two losses

Remembering that the 2007-08 season began with a win and a tie vs. Michigan St and Boston College, I ran the numbers to see what effect changing those to losses would have on the end-of-season PWR.

Actual PWR PWR with modified results
Michigan (24) Michigan (24)
Miami (23) Miami (23)
North Dakota (22) New Hampshire (22)
New Hampshire (21) Colorado College (21)
Colorado College (20) North Dakota (20)
Boston College (18) Denver (18)
Denver (18) Michigan St (18)
St Cloud (17) Boston College (17)
Michigan St (16) St Cloud (16)
Clarkson (16) Clarkson (16)
Minnesota (14) Minnesota (14)
Wisconsin (11) Notre Dame (10)
Notre Dame (10) Mankato (10)
Mankato (10) Harvard (10)

Those small seeming changes cause the Sioux to lose two more comparisons and drop two spots. (Of course, they also somewhat save face for the selection process by knocking Wisconsin out in favor of Mankato).

A look forward to the 2008-09 PWR

Oct. 14, 2008 updated — Hat tip to NodakVindy for correctly pointing out that the list should include all opponents of BU & Mass.

Given the volatility of PWR itself, it’s pretty hard to predict the effects of two games on PWR at this point.

At a minimum, we know UND will have an additional 0-1 added to its common opponents’ comparison for each opponent of Massachusetts and Boston University (0-2 for opponents of both). That can be particularly important when comparing to out-of-conference teams who won’t have a lot of opponents in common with the Sioux.

Rated from most damage to least, here’s how the weekend’s losses will play into UND’s COP comparisons with teams that have played or will play BU or Massachusetts.

Team UND’s Scheduled COPs UND record to date vs. COPs
(percent of COP)
American Int’l 1 0-1 (100%)
Vermont 2 0-2 (100%)
Providence 2 0-2 (100%)
Merrimack 2 0-2 (100%)
Mass.-Lowell 5 0-2 (40%)
Holy Cross 3 0-1 (33%)
Harvard 3 0-1 (33%)
Rensselaer 6 0-2 (33%)
St. Lawrence 6 0-2 (33%)
Maine 6 0-2 (33%)
Northeastern 6 0-2 (33%)
Boston University 4 0-1 (25%)
Michigan State 8 0-2 (25%)
Boston College 8 0-2 (25%)
New Hampshire 8 0-2 (25%)
Connecticut 5 0-1 (20%)
Massachusetts 6 0-1 (17%)
Cornell 7 0-1 (14%)
Michigan 10 0-1 (10%)
Bemidji State 13 0-1 (8%)

The losses could also play into UND’s TUC comparisons, if either ends up a TUC, and of course any loss has a small effect on win percentage and RPI.

Bottom Line

It’s quite possible that last weekend’s results will lead to UND losing a comparison or two that it would have won with a split or a sweep. But with 36 scheduled games remaining, the Sioux will have plenty of opportunity to undo that damage. The big open question is certainly the one I opened this article with — what, if anything, did last weekend’s games reveal about the team? Fortunately for us, UND has not announced an intent to forfeit the rest of the season, so we should have 18 more weekends of Sioux hockey to enjoy and find out.

How good is the Coaches’ Poll?

The 2008-09 WCHA Coaches’ Poll is out, and if you’re interested in that you can go view it at the Herald or talk about it on the message board.

The release got me wondering how useful the poll is. Do the coaches make better picks than last year’s final standings? Do the coaches even make better picks than random draw? This post uses some light stats, but I’ll point out the important numbers.

To measure how well the coaches did, I compared their predictions to the actual outcomes (the precise measurement is the sum of the squares of the differences between outcomes and predictions). As a point of comparison, I also compared the previous years’ standings to the actual outcomes, to see if the coaches’ predictions were an improvement over those.

Coaches’ polls’ differences from outcomes vs. previous years’ differences from outcomes (lower numbers are better).

Year Sum
Sq. Diff
Coaches
Poll
Sum
Sq. Diff
Previous
Year
2007 65 84
2006 52 43
2005 21 48
2004 86 89
2003 62 146
Avg 57.2 82

Looks good for the coaches. In only one of the five years was the coaches’ poll a worse predictor than the previous year’s final standings.

Already with some faith in the coaches’ picks, I also compared them to the average performance of random picks. To do that, I performed 200,000 simulations of random picks to get the shape of their performance. Using the same measure as above, throwing darts would achieve the following error:

Mean Std. Dev
175 55.1

Note that the 175 mean squared error for random picks is much bigger than either the 57 the coaches achieved over 5 years or the 82 the previous years’ outcomes achieved. (The coaches’ poll is 2.1 standard deviations better than random picks, the previous years’ outcomes 1.7 standard deviations better). From that, we can conclude that both the previous years’ final standings and the coaches’ poll contain useful information that provides a more accurate prediction than a random draw.

Here’s the raw data:
http://spreadsheets.google.com/pub?key=pDN6PFrUpi3c_P6VEQ353Kw