NCAA hockey tournament selection / PWR possibilities

With only 19 games to go before the NCAA men’s ice hockey tournament selection, the You are the committee calculators are up and running.

I ran through the 1,179,648 remaining possible outcomes, so you don’t have to. The table below shows the percentage outcomes in which each team ends the season with each rank.

Note that this table does not weight the likelihood of outcomes as I usually do, rather this analysis treats all outcomes as equally likely. I’ll followup later with additional analysis that includes some probabilities, games to watch, and more in-depth analysis of UND’s potential scenarios. As always, drop me any requests if there are other questions you’d like answered.

Team PWR Possibilities
Overall Win none Win all
Boston College 1 79.8%
2 19.8%
3 0.4%
1 81.0%
2 19.0%
1 81.7%
2 18.3%
Michigan 1 0.2%
2 66.8%
3 27.1%
4 4.6%
5 1.1%
6 0.1%
2 51.8%
3 33.3%
4 11.1%
5 3.4%
6 0.4%
2 75.0%
3 25.0%
Miami 1 0.3%
2 2.7%
3 20.2%
4 15.3%
5 12.8%
6 12.6%
7 11.0%
8 9.5%
9 7.2%
10 5.4%
11 2.5%
12 0.5%
13 0.1%
14 0.0%
4 0.0%
5 1.0%
6 8.0%
7 19.4%
8 25.1%
9 21.1%
10 16.3%
11 7.4%
12 1.5%
13 0.2%
14 0.0%
1 1.3%
2 10.7%
3 61.2%
4 24.2%
5 2.5%
6 0.2%
UMD 1 19.7%
2 5.5%
3 5.0%
4 11.6%
5 16.4%
6 17.1%
7 15.1%
8 7.6%
9 1.7%
10 0.2%
11 0.0%
3 1.2%
4 5.9%
5 16.3%
6 28.3%
7 29.2%
8 15.1%
9 3.5%
10 0.4%
11 0.1%
1 78.7%
2 19.8%
3 0.3%
4 1.2%
Ferris State 3 7.7%
4 21.0%
5 30.6%
6 26.5%
7 11.5%
8 2.7%
9 0.2%
10 0.0%
n/a n/a
Boston University 2 2.9%
3 14.9%
4 12.1%
5 8.5%
6 9.9%
7 13.6%
8 15.9%
9 12.9%
10 6.7%
11 2.2%
12 0.4%
13 0.0%
4 0.3%
5 1.9%
6 7.2%
7 18.9%
8 28.1%
9 24.9%
10 13.3%
11 4.5%
12 0.9%
13 0.1%
2 11.6%
3 52.3%
4 29.4%
5 6.0%
6 0.7%
7 0.1%
UMN 2 0.4%
3 9.7%
4 10.8%
5 7.9%
6 8.5%
7 13.6%
8 19.8%
9 19.0%
10 8.4%
11 1.7%
12 0.1%
13 0.0%
4 0.0%
5 0.2%
6 3.0%
7 13.0%
8 29.3%
9 34.1%
10 16.6%
11 3.5%
12 0.2%
13 0.0%
2 1.5%
3 37.4%
4 37.2%
5 17.6%
6 5.1%
7 1.1%
8 0.1%
Maine 3 1.1%
4 6.4%
5 8.7%
6 6.7%
7 2.3%
8 2.6%
9 7.5%
10 13.4%
11 21.8%
12 20.2%
13 8.3%
14 1.1%
10 5.7%
11 36.0%
12 39.5%
13 16.6%
14 2.2%
3 4.5%
4 25.5%
5 34.6%
6 26.8%
7 8.3%
8 0.3%
9 0.0%
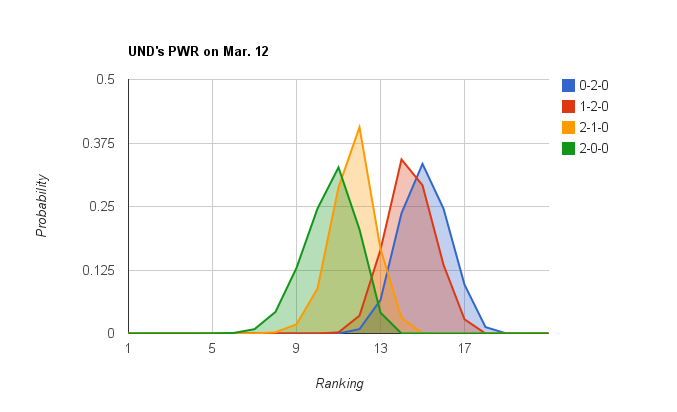
UND 2 0.2%
3 5.1%
4 5.3%
5 2.0%
6 2.1%
7 3.6%
8 6.4%
9 14.6%
10 22.9%
11 19.0%
12 14.2%
13 4.2%
14 0.3%
7 0.0%
8 0.1%
9 7.4%
10 25.6%
11 30.2%
12 27.6%
13 8.5%
14 0.6%
2 1.9%
3 41.1%
4 42.2%
5 13.4%
6 1.3%
7 0.0%
Mass.-Lowell 6 1.1%
7 8.8%
8 17.7%
9 19.6%
10 21.6%
11 20.6%
12 8.9%
13 1.5%
14 0.0%
n/a n/a
Michigan State 13 11.7%
14 41.0%
15 37.1%
16 6.6%
17 3.6%
18 0.1%
n/a n/a
Western Michigan 7 0.0%
8 0.0%
9 0.2%
10 1.1%
11 3.1%
12 7.1%
13 13.0%
14 26.6%
15 21.2%
16 19.9%
17 6.4%
18 1.1%
13 0.9%
14 6.6%
15 14.3%
16 55.7%
17 19.2%
18 3.4%
7 0.1%
8 0.1%
9 1.0%
10 4.6%
11 12.5%
12 27.8%
13 32.9%
14 21.1%
Denver 3 1.2%
4 2.8%
5 4.0%
6 3.2%
7 1.3%
8 0.8%
9 2.5%
10 7.3%
11 16.8%
12 29.7%
13 22.8%
14 7.6%
10 1.3%
11 12.1%
12 37.3%
13 36.0%
14 13.4%
3 9.5%
4 22.4%
5 31.8%
6 25.4%
7 9.8%
8 1.1%
9 0.0%
Northern Michigan 13 1.3%
14 10.2%
15 32.9%
16 51.8%
17 3.8%
n/a n/a
Notre Dame 17 4.4%
18 64.6%
19 28.4%
20 2.6%
n/a n/a
Union 2 1.7%
3 7.6%
4 9.9%
5 6.1%
6 5.8%
7 9.0%
8 11.9%
9 13.7%
10 11.1%
11 6.1%
12 7.8%
13 8.2%
14 1.1%
15 0.0%
6 0.0%
7 0.5%
8 4.1%
9 12.3%
10 17.0%
11 14.9%
12 23.2%
13 24.7%
14 3.2%
15 0.1%
2 6.7%
3 30.1%
4 38.3%
5 18.6%
6 5.0%
7 1.1%
8 0.1%
Merrimack 14 0.0%
15 0.8%
16 9.1%
17 64.1%
18 23.0%
19 3.1%
20 0.0%
n/a n/a
Ohio State 19 19.1%
20 48.9%
21 28.7%
22 3.2%
23 0.2%
n/a n/a
Lake Superior 19 0.4%
20 9.2%
21 36.4%
22 40.6%
23 11.6%
24 1.6%
25 0.2%
26 0.0%
n/a n/a
SCSU 13 0.3%
14 1.5%
15 3.7%
16 3.7%
17 3.7%
18 4.6%
19 15.8%
20 13.5%
21 3.4%
22 7.1%
23 22.1%
24 14.6%
25 5.4%
26 0.6%
20 0.0%
21 0.4%
22 14.2%
23 44.3%
24 29.3%
25 10.7%
26 1.2%
13 2.1%
14 12.0%
15 29.5%
16 27.8%
17 25.8%
18 2.9%
Cornell 4 0.3%
5 1.9%
6 6.5%
7 10.2%
8 5.1%
9 1.0%
10 1.7%
11 6.0%
12 11.0%
13 28.6%
14 10.6%
15 4.3%
16 8.9%
17 3.8%
18 0.3%
11 0.0%
12 0.9%
13 23.5%
14 24.1%
15 12.9%
16 26.6%
17 11.3%
18 0.9%
4 1.2%
5 7.5%
6 26.0%
7 40.7%
8 20.2%
9 3.9%
10 0.4%
11 0.0%
CC 19 0.6%
20 5.4%
21 17.0%
22 34.9%
23 31.1%
24 10.3%
25 0.7%
n/a n/a
Northeastern 24 0.0%
25 0.1%
26 3.6%
27 23.8%
28 51.4%
29 19.2%
30 1.8%
n/a n/a
UW 22 0.3%
23 3.8%
24 26.2%
25 42.7%
26 24.3%
27 2.7%
28 0.1%
n/a n/a
Bemidji State 28 9.3%
29 40.3%
30 37.5%
31 11.1%
32 1.7%
33 0.1%
n/a n/a
New Hampshire 30 0.3%
31 18.8%
32 19.4%
33 5.6%
34 0.3%
Non-TUC 55.5%
n/a n/a
Massachusetts Non-TUC 100.0% n/a n/a
Providence 28 0.5%
29 2.9%
30 6.1%
31 9.4%
32 5.0%
33 1.1%
Non-TUC 75.0%
Non-TUC 100.0% 28 1.9%
29 11.6%
30 24.5%
31 37.5%
32 19.9%
33 4.6%
MTech 22 0.0%
23 0.3%
24 1.7%
25 4.3%
26 5.1%
27 1.2%
28 0.0%
29 1.0%
30 4.2%
31 6.1%
32 1.2%
33 0.0%
Non-TUC 75.0%
Non-TUC 100.0% 22 0.0%
23 2.2%
24 13.6%
25 34.1%
26 40.7%
27 9.3%
Harvard 15 0.0%
16 0.1%
17 10.2%
18 3.0%
19 16.5%
20 13.9%
21 11.7%
22 4.9%
23 7.4%
24 7.0%
25 8.6%
26 7.5%
27 8.0%
28 1.1%
20 0.0%
21 0.0%
22 0.8%
23 9.4%
24 18.4%
25 21.6%
26 22.5%
27 24.0%
28 3.2%
15 0.1%
16 0.6%
17 40.6%
18 12.0%
19 41.6%
20 5.1%
Alaska Non-TUC 100.0% n/a n/a
Colgate 17 0.2%
18 3.3%
19 16.0%
20 5.5%
21 0.1%
22 1.3%
23 10.1%
24 23.5%
25 23.3%
26 13.3%
27 2.7%
28 0.8%
24 8.3%
25 41.9%
26 39.4%
27 8.1%
28 2.3%
17 0.6%
18 13.2%
19 64.1%
20 22.1%
Bowling Green Non-TUC 100.0% Non-TUC 100.0% Non-TUC 100.0%
Nebraska-Omaha Non-TUC 100.0% n/a n/a
Quinnipiac 25 5.7%
26 35.8%
27 45.6%
28 10.8%
29 2.1%
n/a n/a
Yale Non-TUC 100.0% n/a n/a
St. Lawrence Non-TUC 100.0% n/a n/a
Niagara 22 1.2%
23 3.7%
24 6.1%
25 2.9%
26 2.6%
27 6.0%
28 13.6%
29 14.6%
30 18.5%
31 19.5%
32 9.8%
33 1.5%
34 0.1%
28 3.2%
29 11.1%
30 27.4%
31 35.7%
32 19.6%
33 3.0%
34 0.1%
22 4.9%
23 14.6%
24 24.2%
25 11.4%
26 10.0%
27 16.2%
28 10.7%
29 7.0%
30 0.4%
31 0.5%
Mankato Non-TUC 100.0% n/a n/a
Air Force 19 0.0%
20 0.7%
21 2.5%
22 5.7%
23 8.8%
24 6.1%
25 1.1%
26 1.4%
27 2.0%
28 11.4%
29 19.9%
30 26.0%
31 11.5%
32 2.6%
33 0.2%
26 0.0%
27 0.1%
28 1.2%
29 20.7%
30 49.5%
31 23.1%
32 5.2%
33 0.3%
19 0.1%
20 2.9%
21 10.0%
22 22.7%
23 35.2%
24 24.6%
25 4.5%
Clarkson Non-TUC 100.0% n/a n/a
Dartmouth Non-TUC 100.0% n/a n/a
RIT 20 0.2%
21 0.2%
22 0.9%
23 1.0%
24 2.9%
25 5.1%
26 5.8%
27 8.0%
28 1.0%
29 0.1%
30 5.6%
31 10.2%
32 7.0%
33 2.0%
34 0.1%
Non-TUC 50.0%
Non-TUC 100.0% 20 0.7%
21 0.9%
22 3.4%
23 3.9%
24 11.5%
25 20.3%
26 23.2%
27 32.0%
28 4.0%
AA Non-TUC 100.0% n/a n/a
Princeton Non-TUC 100.0% n/a n/a
Mercyhurst Non-TUC 100.0% Non-TUC 100.0% Non-TUC 100.0%
Rensselaer Non-TUC 100.0% n/a n/a
Holy Cross Non-TUC 100.0% n/a n/a
Vermont Non-TUC 100.0% n/a n/a
Brown Non-TUC 100.0% n/a n/a
Robert Morris Non-TUC 100.0% n/a n/a
Bentley Non-TUC 100.0% n/a n/a
Connecticut Non-TUC 100.0% n/a n/a
Canisius Non-TUC 100.0% n/a n/a
Alabama-Huntsville Non-TUC 100.0% n/a n/a
American Int’l Non-TUC 100.0% n/a n/a
Army Non-TUC 100.0% n/a n/a
Sacred Heart Non-TUC 100.0% n/a n/a

This is the last time I’ll post the complete table, from now on I’ll just focus on those teams that can still finish in the top 16.

Resources

WCHA Playoff Preview: UND vs. Bemidji State

November 20, 2011. Bemidji State 1, North Dakota 0.

The last time these two teams met, the Beavers held on for their first victory over UND since 1970 (and second overall). Dan Bakala made 26 saves for BSU and North Dakota fell to 2-6-0 in conference play with the loss.

But Bemidji State hasn’t only been getting it done with great goaltending and tight, low-scoring games. Since November 20th, the Beavers have scored 4 or more goals seven times and compiled a record of 13-8-2. On the flip side, however, Tom Serratore’s squad has given up 4 or more goals eight times.

I’m not certain that BSU would like to play racehorse hockey with North Dakota. Since that November night, the Green and White have notched 4 or more goals twelve times and allowed that number only five times while boasting a record of 16-5-2.

Dave Hakstol’s squad continues to run short, with only eleven “forwards” each night. I use quotation marks because Dan Senkbeil and Joe Gleason are playing up front after beginning the season as defensemen.

Last season (Bemidji’s first in the WCHA), the Beavers advanced to the Final Five, securing a road sweep of Nebraska-Omaha in the first round and dispatching Minnesota-Duluth in the quarterfinals before falling to Denver 6-2 in the semifinals.

North Dakota has hosted the first round of the WCHA playoffs for ten consecutive seasons, a league record. UND is seeking its tenth straight berth in the Final Five, which would also extend the longest active streak in the conference. Minnesota made 11 consecutive Final Five appearances between 1999-2009 and ten consecutive appearances from 1988-1997.

This series marks the first time North Dakota and Bemidji State have ever met in the playoffs. Bemidji will need to win the WCHA Final Five to advance to the NCAA tournament this season, while UND would be squarely on the tournament bubble with a series loss. Any result in which UND advances to St. Paul for the WCHA Final Five would land the Fighting Sioux in fairly safe territory for the NCAA’s.

Bemidji State Team Profile

Head Coach: Tom Serratore (11th season at BSU, 195-162-41 .541)
Pairwise Ranking: t-27th
National Rankings: NR/NR
This Season: 17-16-3 overal, 11-14-3 WCHA (9th)
Last Season: 15-18-5 overall, 8-15-5 WCHA (t-9th)

Team Offense: 2.69 goals scored/game
Team Defense: 2.81 goals allowed/game
Power Play: 21.2% (24 of 13)
Penalty Kill: 84.4% (119 of 141)

Key Players: Junior F Jordan George (18-12-30), Senior F Shea Walters (12-13-25), Senior F Ben Kinne (10-11-21), Senior D Brad Hunt (5-19-24), Freshman D Matt Prapavessis (1-12-13), Senior G Dan Bakala (11-11-2, 2.57 GAA, .914 SV%, 1 SO)

North Dakota Team Profile

Head Coach: Dave Hakstol (8th season at UND, 205-105-30, .647)
Pairwise Ranking: t-12th
National Rankings: #12/#12
This Season: 20-12-3 overall, 16-11-1 WCHA (4th)
Last Season: 32-9-3 overall (NCAA Frozen Four semifinalist), 21-6-1 WCHA (1st)

Team Offense: 3.09 goals scored/game
Team Defense: 2.69 goals allowed/game
Power Play: 21.0% (34 of 162)
Penalty Kill: 81.5% (119 of 146)

Key Players: Junior F Danny Kristo (17-23-40) Junior F Corban Knight (12-22-34), Sophomore F Brock Nelson (23-16-39), Freshman D Nick Mattson (6-12-18), Senior D Ben Blood (2-15-17), Senior G Brad Eidsness (7-3-1, 2.09 GAA, .923 SV%, 1 SO)

By The Numbers

Last Meeting: November 20, 2011 (Bemidji, MN). A scoreless game turned in the third period when North Dakota’s Andrew MacWilliam and Mark MacMillan were penalized on the same play. 72 seconds into the ensuing 5 on 3 advantage, BSU’s Jordan George banged home a loose rebound and the Beavers held on for the 1-0 victory. It was Bemidji State’s first victory over UND in over 40 years.

Last Meeting in Grand Forks: February 27, 2011. Four of the six seniors in the lineup scored a goal as the homestanding Sioux wrapped up a four game season sweep of the Beavers. UND won the Sunday afternoon contest 5-1 after downing BSU 5-2 on Saturday afternoon.

Most Important Meeting: October 15, 2010 (Bemidji, MN). In the first game played at the BREC, North Dakota spotted BSU the opening goal less than two minutes into the contest and then steamrolled the Beavers 5-2. The Fighting Sioux outshot their fellow Green-and-Whiters 38-14.

Last Ten: North Dakota has won nine of the last ten meetings between the teams, outscoring BSU 39-17 during that stretch. One of those UND victories was a 4-3 overtime decision in Grand Forks, while Bemidji State’s lone bright spot was a 1-0 home win earlier this season.

All-time Series: UND leads the all-time series, 22-2-1 (.900), including a 14-1-1 (.906) record in games played in Grand Forks. The two teams have never met in the postseason.

Game News and Notes:

Under head coach Dave Hakstol, North Dakota is 14-3 in the first round of the WCHA playoffs and have yet to lose an opening round series. BSU head coach Tom Serratore will coach in his 400th career game on Saturday night and is five wins short of 200 for his career. Sioux sophomore forward Brock Nelson won the league scoring title with 20 goals in conference action.

The Prediction

It’s always difficult to end a team’s season, and that’s the task North Dakota is faced with this weekend. I have a feeling that the Beavers will attempt to play an up-tempo style in Friday’s opener and lock things down in Saturday’s rematch. This series may go to Sunday, but I’ve got UND in two, with Saturday’s series finale going to overtime. UND 5-2, 3-2 (OT).

Sioux have an opportunity to make PWR gains and position themselves for NCAA tournament berth

The Sioux have an opportunity to make a move in the PairWise Rankings (PWR) and toward an NCAA tournament selection.

Last weekend, a sweep was necessary just to maintain UND’s ranking of #14. The Sioux did sweep and rose modestly to #13.

This weekend, a sweep could easily push UND up a couple more spots into the relative safety of a #10-#12 ranking.

Any outcome in which UND fails to advance, whether winning a single game or none, would leave UND on the bubble for the NCAA tournament. The #14 ranked team stands a fair chance of making the tournament — it does so if 2 or fewer teams outside the top 16 gets autobids. However, UND’s ranking would be quite likely to move a slot or two while the Sioux watched the Final Five from home, leaving UND’s destiny out of its hands.

Likelihood of UND having a particular PWR ranking (or higher) on March 12, based on UND’s performance
0-2-0 1-2-0 2-1-0 2-0-0
1 0.00% 0.00% 0.00% 0.00%
2 0.00% 0.00% 0.00% 0.00%
3 0.00% 0.00% 0.00% 0.00%
4 0.00% 0.00% 0.00% 0.00%
5 0.00% 0.00% 0.00% 0.01%
6 0.00% 0.00% 0.00% 0.11%
7 0.00% 0.00% 0.02% 0.96%
8 0.00% 0.00% 0.26% 5.21%
9 0.00% 0.00% 2.05% 18.12%
10 0.00% 0.00% 10.88% 42.71%
11 0.00% 0.23% 39.66% 75.41%
12 0.86% 3.74% 80.26% 95.90%
13 7.46% 20.22% 96.92% 99.99%
14 31.13% 54.48% 99.99% 100.00%
15 64.52% 83.66% 100.00% 100.00%
16 89.11% 97.21% 100.00% 100.00%
17 98.74% 100.00% 100.00% 100.00%
18 100.00% 100.00% 100.00% 100.00%
19 100.00% 100.00% 100.00% 100.00%
20 100.00% 100.00% 100.00% 100.00%

It doesn’t show up in the table (not enough decimal places), but there is about a 1/1,000,000 scenario in which UND comes out of the weekend #4 in the PWR and positioned for a 1 seed. The lowest likely rank, if swept, is #19.

Who else to watch this weekend

The two separate lists are the series UND cares most about if the Sioux win (outcomes that can flip other comparisons in UND’s favor) and the series that UND cares most about if the Sioux lose (outcomes that can flip comparisons away from UND).

If UND wins:

  • Wisconsin over Denver (win series)
  • Rensselaer over Union (one game if UND sweeps, series if UND goes 2-1)
  • Alaska Anchorage over Minnesota (win series)
  • Merrimack over Maine (win series if UND sweeps, not as important if UND goes 2-1)

If UND loses:

  • Maine over Merrimack (win series)
  • Michigan over Notre Dame (win series)
  • Lake Superior over Wester Michigan (one game)
  • Dartmouth over Cornell (win series)

The series listed are those that increase UND’s PWR by at least .75 on average.

Outlook for all NCAA teams

I didn’t run charts (like the UND chart above) for any teams other than UND yet, but the data is all in the table below. If you’d like to see any particular team in chart form, just let me know.

Here are the likely PWR rankings for each NCAA team as of March 12 (after all of this weekend’s best-of-3 series complete).

Team March 12 PWR Possibilities
Overall Swept Advance (2-1-0 or 2-0-0)
Boston College 1 85.1%
2 12.7%
3 1.4%
4 0.6%
5 0.2%
6 0.0%
7 0.0%
1 27.6%
2 34.0%
3 23.6%
4 11.8%
5 2.9%
6 0.1%
7 0.0%
1 89.4%
2 10.6%
Michigan 1 2.2%
2 34.2%
3 15.4%
4 12.9%
5 13.9%
6 9.6%
7 5.4%
8 3.8%
9 1.8%
10 0.6%
11 0.1%
12 0.0%
2 0.0%
3 0.6%
4 2.8%
5 11.3%
6 20.7%
7 26.4%
8 22.6%
9 11.1%
10 3.5%
11 0.8%
12 0.1%
1 3.5%
2 53.5%
3 22.4%
4 14.3%
5 6.1%
6 0.3%
7 0.0%
Ferris State 1 0.0%
2 13.0%
3 26.0%
4 27.3%
5 18.4%
6 6.9%
7 3.2%
8 2.8%
9 1.7%
10 0.6%
11 0.1%
12 0.0%
2 0.0%
3 0.2%
4 1.5%
5 6.0%
6 12.8%
7 21.4%
8 27.3%
9 20.6%
10 8.2%
11 1.7%
12 0.2%
1 0.1%
2 14.6%
3 29.3%
4 30.4%
5 19.5%
6 5.7%
7 0.5%
8 0.0%
Mass.-Lowell 1 0.9%
2 18.4%
3 27.7%
4 16.0%
5 10.2%
6 9.2%
7 6.7%
8 3.4%
9 2.5%
10 2.6%
11 1.8%
12 0.5%
13 0.0%
2 0.0%
3 0.4%
4 1.4%
5 5.0%
6 12.1%
7 16.8%
8 15.4%
9 14.2%
10 16.9%
11 12.5%
12 4.7%
13 0.5%
1 1.1%
2 22.0%
3 33.0%
4 18.6%
5 10.8%
6 8.4%
7 4.9%
8 1.2%
9 0.1%
10 0.0%
11 0.0%
Boston University 1 0.0%
2 0.4%
3 3.2%
4 13.5%
5 23.7%
6 22.6%
7 11.5%
8 6.6%
9 5.6%
10 6.6%
11 5.0%
12 1.2%
13 0.2%
5 0.0%
6 0.2%
7 1.5%
8 5.6%
9 16.3%
10 31.9%
11 31.0%
12 11.6%
13 1.9%
1 0.0%
2 0.5%
3 4.1%
4 17.2%
5 30.2%
6 28.5%
7 13.1%
8 5.0%
9 1.2%
10 0.1%
11 0.0%
Miami 1 0.1%
2 0.8%
3 3.0%
4 6.0%
5 7.8%
6 8.2%
7 7.5%
8 9.5%
9 9.7%
10 7.0%
11 14.1%
12 17.1%
13 8.9%
14 0.2%
15 0.0%
7 0.0%
8 0.0%
9 0.2%
10 4.6%
11 22.7%
12 41.5%
13 29.9%
14 0.9%
15 0.0%
1 0.2%
2 1.5%
3 5.9%
4 11.9%
5 15.3%
6 16.2%
7 14.5%
8 17.0%
9 13.7%
10 3.2%
11 0.6%
12 0.0%
UMD 1 11.6%
2 20.4%
3 22.4%
4 19.8%
5 12.3%
6 7.3%
7 3.7%
8 1.7%
9 0.6%
10 0.2%
11 0.1%
12 0.0%
13 0.0%
2 0.1%
3 1.7%
4 7.3%
5 16.4%
6 25.3%
7 22.7%
8 14.6%
9 7.5%
10 3.0%
11 1.0%
12 0.2%
13 0.0%
1 12.7%
2 22.4%
3 24.4%
4 20.7%
5 11.5%
6 5.5%
7 2.1%
8 0.6%
9 0.1%
10 0.0%
11 0.0%
Michigan State 3 0.0%
4 0.0%
5 0.0%
6 0.5%
7 2.1%
8 6.8%
9 13.4%
10 15.4%
11 9.9%
12 9.5%
13 17.9%
14 14.3%
15 7.7%
16 2.1%
17 0.4%
18 0.0%
19 0.0%
10 0.0%
11 0.1%
12 8.2%
13 28.8%
14 32.8%
15 21.3%
16 7.1%
17 1.4%
18 0.2%
19 0.0%
3 0.0%
4 0.0%
5 0.1%
6 1.0%
7 4.4%
8 13.8%
9 27.2%
10 31.2%
11 17.9%
12 3.5%
13 0.8%
14 0.1%
UMN 2 0.0%
3 0.3%
4 2.1%
5 7.5%
6 19.3%
7 25.8%
8 15.3%
9 10.1%
10 8.3%
11 6.0%
12 3.7%
13 1.6%
14 0.1%
15 0.0%
7 0.0%
8 0.1%
9 1.0%
10 7.0%
11 20.6%
12 37.8%
13 30.8%
14 2.7%
15 0.1%
2 0.0%
3 0.4%
4 2.3%
5 8.1%
6 21.0%
7 28.0%
8 16.6%
9 10.7%
10 7.8%
11 4.1%
12 1.1%
13 0.0%
Maine 2 0.0%
3 0.0%
4 0.1%
5 0.5%
6 2.1%
7 5.5%
8 11.7%
9 16.1%
10 14.4%
11 11.6%
12 10.3%
13 8.7%
14 9.2%
15 5.7%
16 3.0%
17 0.9%
18 0.2%
19 0.0%
20 0.0%
21 0.0%
11 0.2%
12 3.7%
13 15.8%
14 32.6%
15 27.6%
16 14.6%
17 4.5%
18 1.0%
19 0.1%
20 0.0%
21 0.0%
2 0.0%
3 0.0%
4 0.1%
5 0.9%
6 3.6%
7 9.6%
8 20.4%
9 28.0%
10 23.1%
11 10.6%
12 3.2%
13 0.5%
Denver 1 0.0%
2 0.0%
3 0.1%
4 0.5%
5 1.3%
6 3.2%
7 6.5%
8 11.9%
9 17.6%
10 19.3%
11 16.3%
12 11.9%
13 7.1%
14 2.4%
15 1.3%
16 0.5%
17 0.1%
9 0.0%
10 1.7%
11 12.3%
12 27.8%
13 28.7%
14 16.0%
15 9.3%
16 3.7%
17 0.5%
1 0.0%
2 0.0%
3 0.1%
4 0.7%
5 1.9%
6 4.6%
7 9.5%
8 17.2%
9 25.2%
10 25.2%
11 13.5%
12 2.1%
UND 10 0.0%
11 0.2%
12 3.5%
13 16.5%
14 34.3%
15 29.1%
16 13.6%
17 2.8%
n/a n/a
Notre Dame 8 0.0%
9 0.0%
10 0.1%
11 1.2%
12 4.9%
13 8.7%
14 9.6%
15 7.9%
16 6.3%
17 10.2%
18 20.9%
19 25.7%
20 4.4%
21 0.1%
15 0.0%
16 0.2%
17 5.2%
18 25.1%
19 56.5%
20 12.6%
21 0.4%
8 0.0%
9 0.0%
10 0.4%
11 3.2%
12 13.4%
13 23.9%
14 26.4%
15 21.0%
16 10.6%
17 1.0%
Western Michigan 11 0.1%
12 0.7%
13 5.1%
14 12.6%
15 16.1%
16 14.6%
17 8.7%
18 5.0%
19 14.3%
20 20.7%
21 2.2%
22 0.0%
17 0.0%
18 4.3%
19 28.1%
20 59.2%
21 8.3%
22 0.1%
11 0.1%
12 1.2%
13 9.0%
14 22.0%
15 28.3%
16 25.3%
17 13.3%
18 0.7%
19 0.0%
Northern Michigan 13 0.3%
14 4.4%
15 20.8%
16 31.5%
17 25.8%
18 13.8%
19 3.4%
20 0.1%
21 0.0%
n/a n/a
Merrimack 6 0.0%
7 0.0%
8 0.1%
9 1.0%
10 4.2%
11 9.9%
12 11.8%
13 10.3%
14 5.0%
15 3.0%
16 7.4%
17 14.8%
18 16.3%
19 11.6%
20 3.8%
21 0.8%
22 0.1%
23 0.0%
14 0.0%
15 0.2%
16 2.2%
17 12.4%
18 34.1%
19 35.6%
20 12.4%
21 2.8%
22 0.3%
23 0.0%
6 0.0%
7 0.0%
8 0.3%
9 2.3%
10 9.8%
11 23.2%
12 27.7%
13 24.0%
14 10.9%
15 1.9%
16 0.0%
Union 2 0.0%
3 0.3%
4 1.3%
5 4.3%
6 11.0%
7 21.7%
8 24.7%
9 14.9%
10 10.1%
11 6.6%
12 3.7%
13 1.1%
14 0.1%
15 0.0%
7 0.0%
8 0.6%
9 4.4%
10 13.5%
11 28.6%
12 32.8%
13 16.7%
14 3.1%
15 0.4%
2 0.0%
3 0.3%
4 1.5%
5 4.8%
6 12.2%
7 24.1%
8 27.2%
9 15.8%
10 9.2%
11 3.9%
12 0.8%
13 0.0%
14 0.0%
Lake Superior 14 0.0%
15 0.5%
16 4.1%
17 12.2%
18 15.7%
19 12.4%
20 11.1%
21 11.6%
22 14.4%
23 11.7%
24 5.0%
25 1.2%
26 0.1%
18 0.0%
19 0.1%
20 1.8%
21 10.4%
22 34.1%
23 34.1%
24 15.3%
25 3.8%
26 0.4%
14 0.0%
15 1.1%
16 9.6%
17 28.3%
18 36.0%
19 20.4%
20 3.8%
21 0.8%
22 0.1%
23 0.0%
Ohio State 18 0.3%
19 6.6%
20 24.0%
21 33.4%
22 24.4%
23 9.9%
24 1.5%
25 0.1%
n/a n/a
CC 13 0.0%
14 0.3%
15 3.5%
16 11.7%
17 18.6%
18 21.8%
19 17.4%
20 6.9%
21 10.2%
22 6.6%
23 2.3%
24 0.7%
25 0.1%
18 0.7%
19 4.3%
20 17.2%
21 33.5%
22 27.4%
23 11.9%
24 4.3%
25 0.7%
13 0.0%
14 0.4%
15 5.0%
16 16.7%
17 26.6%
18 30.4%
19 20.2%
20 0.7%
21 0.0%
Cornell 4 0.0%
5 0.0%
6 0.1%
7 0.4%
8 1.8%
9 5.0%
10 10.5%
11 17.2%
12 21.1%
13 13.7%
14 7.4%
15 4.5%
16 5.3%
17 5.6%
18 5.0%
19 2.3%
20 0.1%
13 0.0%
14 0.5%
15 4.9%
16 16.0%
17 27.6%
18 31.7%
19 18.4%
20 0.8%
4 0.0%
5 0.0%
6 0.1%
7 0.5%
8 2.3%
9 6.4%
10 13.6%
11 22.1%
12 27.2%
13 17.2%
14 8.3%
15 1.9%
16 0.3%
17 0.0%
Northeastern 23 0.0%
24 0.1%
25 1.7%
26 9.1%
27 22.4%
28 29.7%
29 23.3%
30 10.5%
31 2.7%
32 0.5%
33 0.1%
34 0.0%
n/a n/a
SCSU 19 0.0%
20 0.2%
21 2.2%
22 9.5%
23 14.8%
24 14.4%
25 12.6%
26 7.3%
27 5.3%
28 6.6%
29 5.8%
30 5.3%
31 6.1%
32 4.7%
33 1.5%
34 0.1%
Non-TUC 3.6%
27 0.0%
28 0.2%
29 2.5%
30 13.1%
31 30.4%
32 25.6%
33 8.1%
34 0.6%
Non-TUC 19.6%
19 0.0%
20 0.4%
21 3.6%
22 15.7%
23 24.5%
24 23.8%
25 20.6%
26 9.7%
27 1.7%
28 0.0%
Bemidji State 20 0.0%
21 0.4%
22 4.1%
23 23.2%
24 35.9%
25 26.2%
26 9.9%
27 0.3%
28 0.0%
n/a n/a
UW 17 0.0%
18 0.3%
19 2.8%
20 9.0%
21 8.7%
22 7.0%
23 5.6%
24 4.5%
25 8.3%
26 14.1%
27 13.1%
28 11.1%
29 9.1%
30 4.8%
31 1.3%
32 0.2%
33 0.0%
34 0.0%
22 0.1%
23 0.6%
24 1.2%
25 2.6%
26 11.0%
27 20.0%
28 25.8%
29 22.8%
30 12.2%
31 3.2%
32 0.4%
33 0.0%
34 0.0%
17 0.0%
18 1.0%
19 8.9%
20 29.1%
21 27.1%
22 19.1%
23 10.8%
24 3.5%
25 0.4%
26 0.0%
Massachusetts 20 0.0%
21 0.0%
22 0.2%
23 0.6%
24 1.1%
25 2.7%
26 4.4%
27 3.4%
28 2.5%
29 4.9%
30 9.8%
31 7.9%
32 2.7%
33 0.7%
34 0.1%
35 0.0%
Non-TUC 59.1%
Non-TUC 100.0% 20 0.0%
21 0.2%
22 1.4%
23 4.1%
24 8.1%
25 19.8%
26 32.3%
27 23.3%
28 8.7%
29 1.8%
30 0.3%
31 0.0%
32 0.0%
New Hampshire 23 0.0%
24 0.0%
25 0.8%
26 3.6%
27 6.1%
28 5.4%
29 3.6%
30 2.7%
31 3.1%
32 3.0%
33 0.7%
34 0.0%
Non-TUC 70.8%
Non-TUC 100.0% 23 0.0%
24 0.2%
25 3.7%
26 16.6%
27 28.0%
28 24.9%
29 15.5%
30 7.7%
31 2.6%
32 0.6%
33 0.1%
34 0.0%
Nebraska-Omaha 23 0.0%
24 0.0%
25 0.2%
26 0.9%
27 2.7%
28 4.7%
29 7.8%
30 7.2%
31 7.1%
32 5.8%
33 2.5%
34 0.5%
35 0.0%
Non-TUC 60.6%
Non-TUC 100.0% 23 0.0%
24 0.0%
25 0.4%
26 2.4%
27 6.7%
28 11.9%
29 19.7%
30 18.2%
31 17.9%
32 14.7%
33 6.2%
34 1.2%
35 0.1%
Non-TUC 0.5%
Harvard 17 0.0%
18 0.2%
19 2.0%
20 10.2%
21 10.3%
22 10.9%
23 11.4%
24 12.6%
25 9.8%
26 7.6%
27 6.0%
28 2.7%
29 2.6%
30 5.6%
31 5.8%
32 2.2%
33 0.2%
34 0.0%
26 0.0%
27 0.1%
28 2.0%
29 13.7%
30 34.3%
31 35.7%
32 13.3%
33 0.9%
34 0.0%
17 0.0%
18 0.2%
19 3.1%
20 15.9%
21 16.1%
22 17.0%
23 17.7%
24 18.5%
25 10.0%
26 1.5%
27 0.0%
Alaska Non-TUC 100.0% n/a n/a
Providence Non-TUC 100.0% Non-TUC 100.0% Non-TUC 100.0%
MTech Non-TUC 100.0% Non-TUC 100.0% Non-TUC 100.0%
Quinnipiac 16 0.0%
17 0.1%
18 0.5%
19 1.2%
20 4.0%
21 6.5%
22 10.2%
23 11.4%
24 10.6%
25 9.3%
26 9.7%
27 10.6%
28 9.6%
29 8.9%
30 5.2%
31 1.7%
32 0.5%
33 0.1%
34 0.0%
24 0.1%
25 1.1%
26 3.8%
27 9.9%
28 21.9%
29 32.9%
30 20.8%
31 6.9%
32 2.0%
33 0.4%
34 0.0%
16 0.0%
17 0.1%
18 1.0%
19 2.5%
20 8.0%
21 12.9%
22 20.3%
23 22.6%
24 20.1%
25 11.0%
26 1.5%
27 0.0%
Colgate 18 0.0%
19 0.3%
20 5.6%
21 13.5%
22 12.6%
23 8.7%
24 6.6%
25 4.6%
26 4.2%
27 6.1%
28 7.8%
29 7.1%
30 9.1%
31 8.8%
32 3.5%
33 0.8%
34 0.1%
Non-TUC 0.7%
25 0.0%
26 0.1%
27 0.7%
28 3.4%
29 13.0%
30 29.1%
31 33.6%
32 13.8%
33 3.1%
34 0.2%
Non-TUC 2.9%
18 0.0%
19 0.6%
20 11.2%
21 27.1%
22 25.2%
23 17.1%
24 12.0%
25 6.0%
26 0.6%
27 0.2%
28 0.0%
Bowling Green Non-TUC 100.0% Non-TUC 100.0% Non-TUC 100.0%
Yale 23 0.0%
24 0.2%
25 1.4%
26 3.4%
27 4.6%
28 3.9%
29 4.0%
30 5.5%
31 6.4%
32 4.1%
33 1.6%
34 0.5%
35 0.1%
Non-TUC 64.3%
Non-TUC 100.0% 23 0.1%
24 0.7%
25 3.8%
26 9.5%
27 12.9%
28 11.0%
29 11.2%
30 15.5%
31 17.9%
32 11.4%
33 4.5%
34 1.3%
35 0.1%
Dartmouth Non-TUC 100.0% Non-TUC 100.0% Non-TUC 100.0%
St. Lawrence Non-TUC 100.0% n/a n/a
Mankato Non-TUC 100.0% Non-TUC 100.0% Non-TUC 100.0%
Clarkson Non-TUC 100.0% n/a n/a
Air Force 22 0.0%
23 0.4%
24 6.9%
25 20.9%
26 23.8%
27 14.3%
28 6.1%
29 2.5%
30 0.7%
31 0.5%
32 0.7%
33 0.5%
34 0.2%
35 0.0%
Non-TUC 22.5%
Non-TUC 100.0% 22 0.0%
23 0.5%
24 9.1%
25 27.7%
26 31.6%
27 19.0%
28 8.0%
29 3.3%
30 0.7%
31 0.0%
RIT 23 0.0%
24 0.0%
25 0.2%
26 1.4%
27 3.8%
28 6.0%
29 11.1%
30 16.2%
31 13.8%
32 11.4%
33 6.0%
34 1.6%
35 0.2%
Non-TUC 28.6%
Non-TUC 100.0% 23 0.0%
24 0.0%
25 0.2%
26 1.9%
27 5.2%
28 8.4%
29 15.5%
30 22.6%
31 19.3%
32 15.9%
33 8.3%
34 2.3%
35 0.3%
Non-TUC 0.0%
Niagara 24 0.0%
25 0.1%
26 0.4%
27 1.4%
28 3.9%
29 8.8%
30 13.0%
31 15.2%
32 11.6%
33 5.9%
34 1.4%
35 0.1%
Non-TUC 38.3%
Non-TUC 100.0% 24 0.0%
25 0.1%
26 0.7%
27 2.3%
28 6.3%
29 14.2%
30 21.0%
31 24.6%
32 18.7%
33 9.5%
34 2.3%
35 0.2%
Non-TUC 0.0%
AA Non-TUC 100.0% Non-TUC 100.0% Non-TUC 100.0%
Princeton Non-TUC 100.0% n/a n/a
Rensselaer Non-TUC 100.0% Non-TUC 100.0% Non-TUC 100.0%
Mercyhurst Non-TUC 100.0% Non-TUC 100.0% Non-TUC 100.0%
Holy Cross Non-TUC 100.0% Non-TUC 100.0% Non-TUC 100.0%
Robert Morris Non-TUC 100.0% Non-TUC 100.0% Non-TUC 100.0%
Vermont Non-TUC 100.0% n/a n/a
Brown Non-TUC 100.0% n/a n/a
Bentley Non-TUC 100.0% Non-TUC 100.0% Non-TUC 100.0%
Connecticut Non-TUC 100.0% Non-TUC 100.0% Non-TUC 100.0%
Canisius Non-TUC 100.0% n/a n/a
Alabama-Huntsville Non-TUC 100.0% n/a n/a
American Int’l Non-TUC 100.0% n/a n/a
Army Non-TUC 100.0% n/a n/a
Sacred Heart Non-TUC 100.0% n/a n/a

This is probably the last time this season I’ll publish the entire NCAA. Next week I’ll pare it down to those within sight of making the NCAA tournament.

Methodology

Each forecast is based on at least one million monte carlo simulations of the games in the described period. For each simulation, the PairWise Ranking (PWR) is calculated and the results tallied. The probabilities presented in the forecasts are the share of simulations in which a particular outcome occurred.

The outcome of each game in each simulation is determined by random draw, with the probability of victory for each team set by their relative KRACH ratings. So, if the simulation set included a contest between team A with KRACH 300 and team B with KRACH 100, team A will win the game in very close to 75% of the simulations.

Resources

Weekend Preview: North Dakota vs. MSU-Mankato

On the surface, it looks like Troy Jutting’s Mavericks are playing better in the second half after a dismal 3-12-1 start to the season. Mankato has picked up points in six consecutive weekends of WCHA play, going 6-5-1 in those twelve games.

But there’s another way to look at the “tale of two seasons” for MSU-M. The Mavs have fared well against the other teams in the bottom six (St. Cloud State, Wisconsin, Bemidji State, Michigan Tech, and Alaska Anchorage), forging a record of 7-6-1. Mankato hasn’t yet played North Dakota, but has struggled against the others in the top six (Minnesota, Minnesota-Duluth, Denver, Colorado College, and Nebraska-Omaha), winning just once in 12 games (1-10-1).

Minnesota State-Mankato has been led by their freshman class. The seven first-year skaters have scored 31 goals and added 51 assists for 82 points in 164 games played, an average of .5 points per game for the entire class.

By contrast, North Dakota’s nine rookie skaters have netted 27 goals and chipped in 38 helpers for 65 total points in 229 games played for an average of .28 points per game.

UND’s second half resurgence has been helped by junior forward Carter Rowney, who has netted 16 goals this season, eight during the month of February alone.

North Dakota will be unable to field a full complement of players for this weekend’s action, as sophomore forward Taylor Dickin (lower body injury) joins a long list of injured Sioux players. North Dakota will dress nine forwards and eight defensemen for the two game series, with blueliners Joe Gleason and Dan Senkbeil playing up front. Despite the injuries, UND is 14-5-2 (.714) in their last 21 games.

Dave Hakstol’s team has secured home ice for the first round of the WCHA playoffs and sits squarely on the bubble for the NCAA tournament. Anything less than a sweep this weekend would be devastating for North Dakota’s postseason chances.

MSU-Mankato Team Profile

Head Coach: Troy Jutting (12th season at MSUM, 184-220-55, .461)
Pairwise Ranking: NR
National Rankings: NR
This Season: 12-20-2 overall, 8-16-2 WCHA (11th)
Last Season: 14-18-6, 8-16-4 WCHA (11th)

Team Offense: 2.79 goals scored/game
Team Defense: 3.38 goals allowed/game
Power Play: 20.4% (33 of 162)
Penalty Kill: 79.3% (130 of 164)

Key Players: Freshman F Jean-Paul Lafontaine (13-15-28), Freshman F Matt Leitner (9-18-27), Senior F Michael Dorr (8-10-18), Freshman D Zach Palmquist (6-12-18), Junior D Evan Mosey (2-8-10), Senior G Austin Lee (5-13-1, 3.20 GAA, .905 SV%, 1 SO)

North Dakota Team Profile

Head Coach: Dave Hakstol (8th season at UND, 205-105-30, .647)
Pairwise Ranking: 14th
National Rankings: #14/#15
This Season: 18-12-3 overall, 14-11-1 WCHA (4th)
Last Season: 32-9-3 overall (NCAA Frozen Four semifinalist), 21-6-1 WCHA (1st)

Team Offense: 3.06 goals scored/game
Team Defense: 2.79 goals allowed/game
Power Play: 21.7% (33 of 152)
Penalty Kill: 80.7% (113 of 140)

Key Players: Junior F Danny Kristo (15-21-36) Junior F Corban Knight (12-20-32), Sophomore F Brock Nelson (22-16-38), Freshman D Nick Mattson (5-11-16), Senior D Ben Blood (2-14-16), Senior G Brad Eidsness (6-3-1, 2.30 GAA, .914 SV%)

By The Numbers

Last Meeting: December 12, 2010 (Mankato, MN). In a rare Sunday afternoon contest, UND again rallied from an early deficit to secure the road victory, 4-2. Down one goal late in the game, the Mavericks couldn’t capitalize on nearly two minutes of 5 on 3 play, and North Dakota forward Evan Trupp iced the contest with an empty-netter in the final minute. On Friday night, the Green and White scored three 3rd period goals in under three minutes to come back and win 4-3.

Last Meeting in Grand Forks: January 9, 1010. North Dakota got two goals from Jason Gregoire for the second consecutive game and completed the sweep of the visiting Mavs, 3-2. The Fighting Sioux won Friday’s opener, 4-1. The game also marked junior forward Matt Frattin’s return to the lineup after serving a first-half suspension.

All-time Series: UND leads the all-time series, 35-10-7 (.740), including a 21-6-3 (.750) record in games played in Grand Forks.

Last ten: North Dakota has a sparkling 9-1-0 (.900) record in the last ten contests, and has lost just once in the last 18 meetings (16-1-1).

Game News and Notes

UND head coach Dave Hakstol is 20-3-2 (.840) against the Mavericks in his career. MSU-Mankato is just 1-11-1 when trailing after the opening period of play. North Dakota is 12-4-3 at home this season, but three of those four losses were by four goals (Boston College, Minnesota, St. Cloud State).

The Prediction

North Dakota is just 8-5-1 against the bottom six teams in the league, but they’ll add two wins to that total this weekend. UND will struggle in Saturday’s rematch, but special teams will be key. UND 5-2, 3-2.