A deeper dive into whether UND will make the NCAA tournament

If UND wins the WCHA tournament, the Sioux will be ensured an NCAA tournament appearance.

If the Sioux bow out early, they will be at the mercy of their final PWR ranking and the outcomes of other conferences’ tournaments (which will determine how many teams get in on the basis of their PWR ranking).

The good news is that the Sioux are very well positioned, and would miss the NCAA tournament in only a few percent of the remaining possible scenarios. For (much) more detail on what it would take, read on.

How many teams will make the tournament at large?

16 teams total will make the tournament. The winners of each conference tournament are guaranteed a spot, then the remaining spots are filled with the top teams from the PWR Rankings.

So, if only 1 team that’s not in the top 16 wins a conference tournament, the top 15 in the PWR will make it. If 3 teams that aren’t in the top 16 win conference tournaments, the top 13 in PWR will also make it.

Here are the conference tournament participants, with those that could win without climbing to the top 16 in PWR marked.

WCHA
* Michigan Tech
Denver
Minnesota Duluth
* St. Cloud St
North Dakota
Minnesota

Hockey East
Maine
Boston University
* Providence
Boston College

ECAC
* Harvard
Cornell
* Colgate
Union

CCHA
Miami
Western Michigan
* Bowling Green
Michigan

Atlantic Hockey
* RIT
* Niagara
* Mercyhurst
* Air Force

So, the PWR ranking a team needs to make the tournament at large is 16 minus however many conferences are won by teams marked above. 13 is generally a pretty good guess, but it could obviously vary.

If UND loses to St. Cloud

This scenario is, obviously, the one in which UND’s tournament chances are the most threatened.

UND PWR ranking share of outcomes if UND loses to SCSU
7 0%
8 0%
9 7%
10 26%
11 30%
12 28%
13 8%
14 1%
15 0%
16 0%

Fortunately, things still look pretty good for UND, even with this outcome. The odds of UND falling to 13, which is likely to be safe, are only 8%. In only about 1% of scenarios does UND fall to 14.

By far the game that matters most to UND in this scenario is BU defeating Maine.

UND PWR ranking share of outcomes if UND loses to SCSU, by BU/Maine outcome
UND Rank If BU
defeats Maine
If Maine
defeats BU
7 0.0% 0.0%
8 0.2% 0.0%
9 14.6% 0.2%
10 42.3% 8.9%
11 33.5% 27.0%
12 9.0% 46.2%
13 0.5% 16.4%
14 0.0% 1.3%
15 0.0% 0.0%

Other outcomes that would help UND in this scenario include:

  • Michigan Tech over Denver
  • Harvard over Cornell
  • Harvard over Union
  • Colgate over Union
  • Michigan Tech over Minnesota-Duluth
  • Colgate over Cornell

Play with that information a bit in the YATC calculators and you should get a pretty good idea of what UND would need to have happen.

If UND defeats St. Cloud

UND PWR ranking share of outcomes if UND defeats SCSU
5 0.0%
6 0.1%
7 1.9%
8 12.7%
9 32.9%
10 35.8%
11 14.7%
12 1.8%
13 0.0%

This isn’t quite mathematically a lock. #12 can miss the tournament if all 5 conferences are won by a team not in the top 16. Since this scenario requires SCSU to be eliminated, the only remaining WCHA team that could win without being top 16 is Michigan Tech. Providence and Bowling Green are also the only teams capable of winning their conferences without rising into the top 16.

So, it appears that if the Sioux beat SCSU, they can only miss the tournament if Michigan Tech, Providence, and Bowling Green all win their conference tournaments and Harvard or Colgate win the ECAC.

If UND defeats St. Cloud and Minnesota

Given the above, Sioux fans are likely to expect this scenario to be a lock for UND. But, the entire fun of simulating all the outcomes is finding those unexpected niche outcomes.

UND PWR ranking share of outcomes if UND defeats SCSU and Minnesota
PWR UND loses
championship
UND wins
championship
1 0.0% 0.00%
2 0.0% 1.92%
3 0.0% 41.07%
4 0.0% 42.22%
5 2.7% 13.42%
6 15.0% 1.34%
7 25.1% 0.03%
8 25.6% 0.00%
9 21.1% 0.00%
10 9.0% 0.00%
11 1.5% 0.00%
12 0.1% 0.00%
13 0.0% 0.00%

Surprisingly, this isn’t a lock either. Again, #12 can miss in some (very unlikely) scenarios.

However, more Sioux fans who have read this far are probably eying that (still slim) chance of finishing #2 overall.

Resources

NCAA hockey tournament selection / PWR possibilities

With only 19 games to go before the NCAA men’s ice hockey tournament selection, the You are the committee calculators are up and running.

I ran through the 1,179,648 remaining possible outcomes, so you don’t have to. The table below shows the percentage outcomes in which each team ends the season with each rank.

Note that this table does not weight the likelihood of outcomes as I usually do, rather this analysis treats all outcomes as equally likely. I’ll followup later with additional analysis that includes some probabilities, games to watch, and more in-depth analysis of UND’s potential scenarios. As always, drop me any requests if there are other questions you’d like answered.

Team PWR Possibilities
Overall Win none Win all
Boston College 1 79.8%
2 19.8%
3 0.4%
1 81.0%
2 19.0%
1 81.7%
2 18.3%
Michigan 1 0.2%
2 66.8%
3 27.1%
4 4.6%
5 1.1%
6 0.1%
2 51.8%
3 33.3%
4 11.1%
5 3.4%
6 0.4%
2 75.0%
3 25.0%
Miami 1 0.3%
2 2.7%
3 20.2%
4 15.3%
5 12.8%
6 12.6%
7 11.0%
8 9.5%
9 7.2%
10 5.4%
11 2.5%
12 0.5%
13 0.1%
14 0.0%
4 0.0%
5 1.0%
6 8.0%
7 19.4%
8 25.1%
9 21.1%
10 16.3%
11 7.4%
12 1.5%
13 0.2%
14 0.0%
1 1.3%
2 10.7%
3 61.2%
4 24.2%
5 2.5%
6 0.2%
UMD 1 19.7%
2 5.5%
3 5.0%
4 11.6%
5 16.4%
6 17.1%
7 15.1%
8 7.6%
9 1.7%
10 0.2%
11 0.0%
3 1.2%
4 5.9%
5 16.3%
6 28.3%
7 29.2%
8 15.1%
9 3.5%
10 0.4%
11 0.1%
1 78.7%
2 19.8%
3 0.3%
4 1.2%
Ferris State 3 7.7%
4 21.0%
5 30.6%
6 26.5%
7 11.5%
8 2.7%
9 0.2%
10 0.0%
n/a n/a
Boston University 2 2.9%
3 14.9%
4 12.1%
5 8.5%
6 9.9%
7 13.6%
8 15.9%
9 12.9%
10 6.7%
11 2.2%
12 0.4%
13 0.0%
4 0.3%
5 1.9%
6 7.2%
7 18.9%
8 28.1%
9 24.9%
10 13.3%
11 4.5%
12 0.9%
13 0.1%
2 11.6%
3 52.3%
4 29.4%
5 6.0%
6 0.7%
7 0.1%
UMN 2 0.4%
3 9.7%
4 10.8%
5 7.9%
6 8.5%
7 13.6%
8 19.8%
9 19.0%
10 8.4%
11 1.7%
12 0.1%
13 0.0%
4 0.0%
5 0.2%
6 3.0%
7 13.0%
8 29.3%
9 34.1%
10 16.6%
11 3.5%
12 0.2%
13 0.0%
2 1.5%
3 37.4%
4 37.2%
5 17.6%
6 5.1%
7 1.1%
8 0.1%
Maine 3 1.1%
4 6.4%
5 8.7%
6 6.7%
7 2.3%
8 2.6%
9 7.5%
10 13.4%
11 21.8%
12 20.2%
13 8.3%
14 1.1%
10 5.7%
11 36.0%
12 39.5%
13 16.6%
14 2.2%
3 4.5%
4 25.5%
5 34.6%
6 26.8%
7 8.3%
8 0.3%
9 0.0%
UND 2 0.2%
3 5.1%
4 5.3%
5 2.0%
6 2.1%
7 3.6%
8 6.4%
9 14.6%
10 22.9%
11 19.0%
12 14.2%
13 4.2%
14 0.3%
7 0.0%
8 0.1%
9 7.4%
10 25.6%
11 30.2%
12 27.6%
13 8.5%
14 0.6%
2 1.9%
3 41.1%
4 42.2%
5 13.4%
6 1.3%
7 0.0%
Mass.-Lowell 6 1.1%
7 8.8%
8 17.7%
9 19.6%
10 21.6%
11 20.6%
12 8.9%
13 1.5%
14 0.0%
n/a n/a
Michigan State 13 11.7%
14 41.0%
15 37.1%
16 6.6%
17 3.6%
18 0.1%
n/a n/a
Western Michigan 7 0.0%
8 0.0%
9 0.2%
10 1.1%
11 3.1%
12 7.1%
13 13.0%
14 26.6%
15 21.2%
16 19.9%
17 6.4%
18 1.1%
13 0.9%
14 6.6%
15 14.3%
16 55.7%
17 19.2%
18 3.4%
7 0.1%
8 0.1%
9 1.0%
10 4.6%
11 12.5%
12 27.8%
13 32.9%
14 21.1%
Denver 3 1.2%
4 2.8%
5 4.0%
6 3.2%
7 1.3%
8 0.8%
9 2.5%
10 7.3%
11 16.8%
12 29.7%
13 22.8%
14 7.6%
10 1.3%
11 12.1%
12 37.3%
13 36.0%
14 13.4%
3 9.5%
4 22.4%
5 31.8%
6 25.4%
7 9.8%
8 1.1%
9 0.0%
Northern Michigan 13 1.3%
14 10.2%
15 32.9%
16 51.8%
17 3.8%
n/a n/a
Notre Dame 17 4.4%
18 64.6%
19 28.4%
20 2.6%
n/a n/a
Union 2 1.7%
3 7.6%
4 9.9%
5 6.1%
6 5.8%
7 9.0%
8 11.9%
9 13.7%
10 11.1%
11 6.1%
12 7.8%
13 8.2%
14 1.1%
15 0.0%
6 0.0%
7 0.5%
8 4.1%
9 12.3%
10 17.0%
11 14.9%
12 23.2%
13 24.7%
14 3.2%
15 0.1%
2 6.7%
3 30.1%
4 38.3%
5 18.6%
6 5.0%
7 1.1%
8 0.1%
Merrimack 14 0.0%
15 0.8%
16 9.1%
17 64.1%
18 23.0%
19 3.1%
20 0.0%
n/a n/a
Ohio State 19 19.1%
20 48.9%
21 28.7%
22 3.2%
23 0.2%
n/a n/a
Lake Superior 19 0.4%
20 9.2%
21 36.4%
22 40.6%
23 11.6%
24 1.6%
25 0.2%
26 0.0%
n/a n/a
SCSU 13 0.3%
14 1.5%
15 3.7%
16 3.7%
17 3.7%
18 4.6%
19 15.8%
20 13.5%
21 3.4%
22 7.1%
23 22.1%
24 14.6%
25 5.4%
26 0.6%
20 0.0%
21 0.4%
22 14.2%
23 44.3%
24 29.3%
25 10.7%
26 1.2%
13 2.1%
14 12.0%
15 29.5%
16 27.8%
17 25.8%
18 2.9%
Cornell 4 0.3%
5 1.9%
6 6.5%
7 10.2%
8 5.1%
9 1.0%
10 1.7%
11 6.0%
12 11.0%
13 28.6%
14 10.6%
15 4.3%
16 8.9%
17 3.8%
18 0.3%
11 0.0%
12 0.9%
13 23.5%
14 24.1%
15 12.9%
16 26.6%
17 11.3%
18 0.9%
4 1.2%
5 7.5%
6 26.0%
7 40.7%
8 20.2%
9 3.9%
10 0.4%
11 0.0%
CC 19 0.6%
20 5.4%
21 17.0%
22 34.9%
23 31.1%
24 10.3%
25 0.7%
n/a n/a
Northeastern 24 0.0%
25 0.1%
26 3.6%
27 23.8%
28 51.4%
29 19.2%
30 1.8%
n/a n/a
UW 22 0.3%
23 3.8%
24 26.2%
25 42.7%
26 24.3%
27 2.7%
28 0.1%
n/a n/a
Bemidji State 28 9.3%
29 40.3%
30 37.5%
31 11.1%
32 1.7%
33 0.1%
n/a n/a
New Hampshire 30 0.3%
31 18.8%
32 19.4%
33 5.6%
34 0.3%
Non-TUC 55.5%
n/a n/a
Massachusetts Non-TUC 100.0% n/a n/a
Providence 28 0.5%
29 2.9%
30 6.1%
31 9.4%
32 5.0%
33 1.1%
Non-TUC 75.0%
Non-TUC 100.0% 28 1.9%
29 11.6%
30 24.5%
31 37.5%
32 19.9%
33 4.6%
MTech 22 0.0%
23 0.3%
24 1.7%
25 4.3%
26 5.1%
27 1.2%
28 0.0%
29 1.0%
30 4.2%
31 6.1%
32 1.2%
33 0.0%
Non-TUC 75.0%
Non-TUC 100.0% 22 0.0%
23 2.2%
24 13.6%
25 34.1%
26 40.7%
27 9.3%
Harvard 15 0.0%
16 0.1%
17 10.2%
18 3.0%
19 16.5%
20 13.9%
21 11.7%
22 4.9%
23 7.4%
24 7.0%
25 8.6%
26 7.5%
27 8.0%
28 1.1%
20 0.0%
21 0.0%
22 0.8%
23 9.4%
24 18.4%
25 21.6%
26 22.5%
27 24.0%
28 3.2%
15 0.1%
16 0.6%
17 40.6%
18 12.0%
19 41.6%
20 5.1%
Alaska Non-TUC 100.0% n/a n/a
Colgate 17 0.2%
18 3.3%
19 16.0%
20 5.5%
21 0.1%
22 1.3%
23 10.1%
24 23.5%
25 23.3%
26 13.3%
27 2.7%
28 0.8%
24 8.3%
25 41.9%
26 39.4%
27 8.1%
28 2.3%
17 0.6%
18 13.2%
19 64.1%
20 22.1%
Bowling Green Non-TUC 100.0% Non-TUC 100.0% Non-TUC 100.0%
Nebraska-Omaha Non-TUC 100.0% n/a n/a
Quinnipiac 25 5.7%
26 35.8%
27 45.6%
28 10.8%
29 2.1%
n/a n/a
Yale Non-TUC 100.0% n/a n/a
St. Lawrence Non-TUC 100.0% n/a n/a
Niagara 22 1.2%
23 3.7%
24 6.1%
25 2.9%
26 2.6%
27 6.0%
28 13.6%
29 14.6%
30 18.5%
31 19.5%
32 9.8%
33 1.5%
34 0.1%
28 3.2%
29 11.1%
30 27.4%
31 35.7%
32 19.6%
33 3.0%
34 0.1%
22 4.9%
23 14.6%
24 24.2%
25 11.4%
26 10.0%
27 16.2%
28 10.7%
29 7.0%
30 0.4%
31 0.5%
Mankato Non-TUC 100.0% n/a n/a
Air Force 19 0.0%
20 0.7%
21 2.5%
22 5.7%
23 8.8%
24 6.1%
25 1.1%
26 1.4%
27 2.0%
28 11.4%
29 19.9%
30 26.0%
31 11.5%
32 2.6%
33 0.2%
26 0.0%
27 0.1%
28 1.2%
29 20.7%
30 49.5%
31 23.1%
32 5.2%
33 0.3%
19 0.1%
20 2.9%
21 10.0%
22 22.7%
23 35.2%
24 24.6%
25 4.5%
Clarkson Non-TUC 100.0% n/a n/a
Dartmouth Non-TUC 100.0% n/a n/a
RIT 20 0.2%
21 0.2%
22 0.9%
23 1.0%
24 2.9%
25 5.1%
26 5.8%
27 8.0%
28 1.0%
29 0.1%
30 5.6%
31 10.2%
32 7.0%
33 2.0%
34 0.1%
Non-TUC 50.0%
Non-TUC 100.0% 20 0.7%
21 0.9%
22 3.4%
23 3.9%
24 11.5%
25 20.3%
26 23.2%
27 32.0%
28 4.0%
AA Non-TUC 100.0% n/a n/a
Princeton Non-TUC 100.0% n/a n/a
Mercyhurst Non-TUC 100.0% Non-TUC 100.0% Non-TUC 100.0%
Rensselaer Non-TUC 100.0% n/a n/a
Holy Cross Non-TUC 100.0% n/a n/a
Vermont Non-TUC 100.0% n/a n/a
Brown Non-TUC 100.0% n/a n/a
Robert Morris Non-TUC 100.0% n/a n/a
Bentley Non-TUC 100.0% n/a n/a
Connecticut Non-TUC 100.0% n/a n/a
Canisius Non-TUC 100.0% n/a n/a
Alabama-Huntsville Non-TUC 100.0% n/a n/a
American Int’l Non-TUC 100.0% n/a n/a
Army Non-TUC 100.0% n/a n/a
Sacred Heart Non-TUC 100.0% n/a n/a

This is the last time I’ll post the complete table, from now on I’ll just focus on those teams that can still finish in the top 16.

Resources

WCHA Playoff Preview: UND vs. Bemidji State

November 20, 2011. Bemidji State 1, North Dakota 0.

The last time these two teams met, the Beavers held on for their first victory over UND since 1970 (and second overall). Dan Bakala made 26 saves for BSU and North Dakota fell to 2-6-0 in conference play with the loss.

But Bemidji State hasn’t only been getting it done with great goaltending and tight, low-scoring games. Since November 20th, the Beavers have scored 4 or more goals seven times and compiled a record of 13-8-2. On the flip side, however, Tom Serratore’s squad has given up 4 or more goals eight times.

I’m not certain that BSU would like to play racehorse hockey with North Dakota. Since that November night, the Green and White have notched 4 or more goals twelve times and allowed that number only five times while boasting a record of 16-5-2.

Dave Hakstol’s squad continues to run short, with only eleven “forwards” each night. I use quotation marks because Dan Senkbeil and Joe Gleason are playing up front after beginning the season as defensemen.

Last season (Bemidji’s first in the WCHA), the Beavers advanced to the Final Five, securing a road sweep of Nebraska-Omaha in the first round and dispatching Minnesota-Duluth in the quarterfinals before falling to Denver 6-2 in the semifinals.

North Dakota has hosted the first round of the WCHA playoffs for ten consecutive seasons, a league record. UND is seeking its tenth straight berth in the Final Five, which would also extend the longest active streak in the conference. Minnesota made 11 consecutive Final Five appearances between 1999-2009 and ten consecutive appearances from 1988-1997.

This series marks the first time North Dakota and Bemidji State have ever met in the playoffs. Bemidji will need to win the WCHA Final Five to advance to the NCAA tournament this season, while UND would be squarely on the tournament bubble with a series loss. Any result in which UND advances to St. Paul for the WCHA Final Five would land the Fighting Sioux in fairly safe territory for the NCAA’s.

Bemidji State Team Profile

Head Coach: Tom Serratore (11th season at BSU, 195-162-41 .541)
Pairwise Ranking: t-27th
National Rankings: NR/NR
This Season: 17-16-3 overal, 11-14-3 WCHA (9th)
Last Season: 15-18-5 overall, 8-15-5 WCHA (t-9th)

Team Offense: 2.69 goals scored/game
Team Defense: 2.81 goals allowed/game
Power Play: 21.2% (24 of 13)
Penalty Kill: 84.4% (119 of 141)

Key Players: Junior F Jordan George (18-12-30), Senior F Shea Walters (12-13-25), Senior F Ben Kinne (10-11-21), Senior D Brad Hunt (5-19-24), Freshman D Matt Prapavessis (1-12-13), Senior G Dan Bakala (11-11-2, 2.57 GAA, .914 SV%, 1 SO)

North Dakota Team Profile

Head Coach: Dave Hakstol (8th season at UND, 205-105-30, .647)
Pairwise Ranking: t-12th
National Rankings: #12/#12
This Season: 20-12-3 overall, 16-11-1 WCHA (4th)
Last Season: 32-9-3 overall (NCAA Frozen Four semifinalist), 21-6-1 WCHA (1st)

Team Offense: 3.09 goals scored/game
Team Defense: 2.69 goals allowed/game
Power Play: 21.0% (34 of 162)
Penalty Kill: 81.5% (119 of 146)

Key Players: Junior F Danny Kristo (17-23-40) Junior F Corban Knight (12-22-34), Sophomore F Brock Nelson (23-16-39), Freshman D Nick Mattson (6-12-18), Senior D Ben Blood (2-15-17), Senior G Brad Eidsness (7-3-1, 2.09 GAA, .923 SV%, 1 SO)

By The Numbers

Last Meeting: November 20, 2011 (Bemidji, MN). A scoreless game turned in the third period when North Dakota’s Andrew MacWilliam and Mark MacMillan were penalized on the same play. 72 seconds into the ensuing 5 on 3 advantage, BSU’s Jordan George banged home a loose rebound and the Beavers held on for the 1-0 victory. It was Bemidji State’s first victory over UND in over 40 years.

Last Meeting in Grand Forks: February 27, 2011. Four of the six seniors in the lineup scored a goal as the homestanding Sioux wrapped up a four game season sweep of the Beavers. UND won the Sunday afternoon contest 5-1 after downing BSU 5-2 on Saturday afternoon.

Most Important Meeting: October 15, 2010 (Bemidji, MN). In the first game played at the BREC, North Dakota spotted BSU the opening goal less than two minutes into the contest and then steamrolled the Beavers 5-2. The Fighting Sioux outshot their fellow Green-and-Whiters 38-14.

Last Ten: North Dakota has won nine of the last ten meetings between the teams, outscoring BSU 39-17 during that stretch. One of those UND victories was a 4-3 overtime decision in Grand Forks, while Bemidji State’s lone bright spot was a 1-0 home win earlier this season.

All-time Series: UND leads the all-time series, 22-2-1 (.900), including a 14-1-1 (.906) record in games played in Grand Forks. The two teams have never met in the postseason.

Game News and Notes:

Under head coach Dave Hakstol, North Dakota is 14-3 in the first round of the WCHA playoffs and have yet to lose an opening round series. BSU head coach Tom Serratore will coach in his 400th career game on Saturday night and is five wins short of 200 for his career. Sioux sophomore forward Brock Nelson won the league scoring title with 20 goals in conference action.

The Prediction

It’s always difficult to end a team’s season, and that’s the task North Dakota is faced with this weekend. I have a feeling that the Beavers will attempt to play an up-tempo style in Friday’s opener and lock things down in Saturday’s rematch. This series may go to Sunday, but I’ve got UND in two, with Saturday’s series finale going to overtime. UND 5-2, 3-2 (OT).

Sioux have an opportunity to make PWR gains and position themselves for NCAA tournament berth

The Sioux have an opportunity to make a move in the PairWise Rankings (PWR) and toward an NCAA tournament selection.

Last weekend, a sweep was necessary just to maintain UND’s ranking of #14. The Sioux did sweep and rose modestly to #13.

This weekend, a sweep could easily push UND up a couple more spots into the relative safety of a #10-#12 ranking.

Any outcome in which UND fails to advance, whether winning a single game or none, would leave UND on the bubble for the NCAA tournament. The #14 ranked team stands a fair chance of making the tournament — it does so if 2 or fewer teams outside the top 16 gets autobids. However, UND’s ranking would be quite likely to move a slot or two while the Sioux watched the Final Five from home, leaving UND’s destiny out of its hands.

Likelihood of UND having a particular PWR ranking (or higher) on March 12, based on UND’s performance
0-2-0 1-2-0 2-1-0 2-0-0
1 0.00% 0.00% 0.00% 0.00%
2 0.00% 0.00% 0.00% 0.00%
3 0.00% 0.00% 0.00% 0.00%
4 0.00% 0.00% 0.00% 0.00%
5 0.00% 0.00% 0.00% 0.01%
6 0.00% 0.00% 0.00% 0.11%
7 0.00% 0.00% 0.02% 0.96%
8 0.00% 0.00% 0.26% 5.21%
9 0.00% 0.00% 2.05% 18.12%
10 0.00% 0.00% 10.88% 42.71%
11 0.00% 0.23% 39.66% 75.41%
12 0.86% 3.74% 80.26% 95.90%
13 7.46% 20.22% 96.92% 99.99%
14 31.13% 54.48% 99.99% 100.00%
15 64.52% 83.66% 100.00% 100.00%
16 89.11% 97.21% 100.00% 100.00%
17 98.74% 100.00% 100.00% 100.00%
18 100.00% 100.00% 100.00% 100.00%
19 100.00% 100.00% 100.00% 100.00%
20 100.00% 100.00% 100.00% 100.00%

It doesn’t show up in the table (not enough decimal places), but there is about a 1/1,000,000 scenario in which UND comes out of the weekend #4 in the PWR and positioned for a 1 seed. The lowest likely rank, if swept, is #19.

Who else to watch this weekend

The two separate lists are the series UND cares most about if the Sioux win (outcomes that can flip other comparisons in UND’s favor) and the series that UND cares most about if the Sioux lose (outcomes that can flip comparisons away from UND).

If UND wins:

  • Wisconsin over Denver (win series)
  • Rensselaer over Union (one game if UND sweeps, series if UND goes 2-1)
  • Alaska Anchorage over Minnesota (win series)
  • Merrimack over Maine (win series if UND sweeps, not as important if UND goes 2-1)

If UND loses:

  • Maine over Merrimack (win series)
  • Michigan over Notre Dame (win series)
  • Lake Superior over Wester Michigan (one game)
  • Dartmouth over Cornell (win series)

The series listed are those that increase UND’s PWR by at least .75 on average.

Outlook for all NCAA teams

I didn’t run charts (like the UND chart above) for any teams other than UND yet, but the data is all in the table below. If you’d like to see any particular team in chart form, just let me know.

Here are the likely PWR rankings for each NCAA team as of March 12 (after all of this weekend’s best-of-3 series complete).

Team March 12 PWR Possibilities
Overall Swept Advance (2-1-0 or 2-0-0)
Boston College 1 85.1%
2 12.7%
3 1.4%
4 0.6%
5 0.2%
6 0.0%
7 0.0%
1 27.6%
2 34.0%
3 23.6%
4 11.8%
5 2.9%
6 0.1%
7 0.0%
1 89.4%
2 10.6%
Michigan 1 2.2%
2 34.2%
3 15.4%
4 12.9%
5 13.9%
6 9.6%
7 5.4%
8 3.8%
9 1.8%
10 0.6%
11 0.1%
12 0.0%
2 0.0%
3 0.6%
4 2.8%
5 11.3%
6 20.7%
7 26.4%
8 22.6%
9 11.1%
10 3.5%
11 0.8%
12 0.1%
1 3.5%
2 53.5%
3 22.4%
4 14.3%
5 6.1%
6 0.3%
7 0.0%
Ferris State 1 0.0%
2 13.0%
3 26.0%
4 27.3%
5 18.4%
6 6.9%
7 3.2%
8 2.8%
9 1.7%
10 0.6%
11 0.1%
12 0.0%
2 0.0%
3 0.2%
4 1.5%
5 6.0%
6 12.8%
7 21.4%
8 27.3%
9 20.6%
10 8.2%
11 1.7%
12 0.2%
1 0.1%
2 14.6%
3 29.3%
4 30.4%
5 19.5%
6 5.7%
7 0.5%
8 0.0%
Mass.-Lowell 1 0.9%
2 18.4%
3 27.7%
4 16.0%
5 10.2%
6 9.2%
7 6.7%
8 3.4%
9 2.5%
10 2.6%
11 1.8%
12 0.5%
13 0.0%
2 0.0%
3 0.4%
4 1.4%
5 5.0%
6 12.1%
7 16.8%
8 15.4%
9 14.2%
10 16.9%
11 12.5%
12 4.7%
13 0.5%
1 1.1%
2 22.0%
3 33.0%
4 18.6%
5 10.8%
6 8.4%
7 4.9%
8 1.2%
9 0.1%
10 0.0%
11 0.0%
Boston University 1 0.0%
2 0.4%
3 3.2%
4 13.5%
5 23.7%
6 22.6%
7 11.5%
8 6.6%
9 5.6%
10 6.6%
11 5.0%
12 1.2%
13 0.2%
5 0.0%
6 0.2%
7 1.5%
8 5.6%
9 16.3%
10 31.9%
11 31.0%
12 11.6%
13 1.9%
1 0.0%
2 0.5%
3 4.1%
4 17.2%
5 30.2%
6 28.5%
7 13.1%
8 5.0%
9 1.2%
10 0.1%
11 0.0%
Miami 1 0.1%
2 0.8%
3 3.0%
4 6.0%
5 7.8%
6 8.2%
7 7.5%
8 9.5%
9 9.7%
10 7.0%
11 14.1%
12 17.1%
13 8.9%
14 0.2%
15 0.0%
7 0.0%
8 0.0%
9 0.2%
10 4.6%
11 22.7%
12 41.5%
13 29.9%
14 0.9%
15 0.0%
1 0.2%
2 1.5%
3 5.9%
4 11.9%
5 15.3%
6 16.2%
7 14.5%
8 17.0%
9 13.7%
10 3.2%
11 0.6%
12 0.0%
UMD 1 11.6%
2 20.4%
3 22.4%
4 19.8%
5 12.3%
6 7.3%
7 3.7%
8 1.7%
9 0.6%
10 0.2%
11 0.1%
12 0.0%
13 0.0%
2 0.1%
3 1.7%
4 7.3%
5 16.4%
6 25.3%
7 22.7%
8 14.6%
9 7.5%
10 3.0%
11 1.0%
12 0.2%
13 0.0%
1 12.7%
2 22.4%
3 24.4%
4 20.7%
5 11.5%
6 5.5%
7 2.1%
8 0.6%
9 0.1%
10 0.0%
11 0.0%
Michigan State 3 0.0%
4 0.0%
5 0.0%
6 0.5%
7 2.1%
8 6.8%
9 13.4%
10 15.4%
11 9.9%
12 9.5%
13 17.9%
14 14.3%
15 7.7%
16 2.1%
17 0.4%
18 0.0%
19 0.0%
10 0.0%
11 0.1%
12 8.2%
13 28.8%
14 32.8%
15 21.3%
16 7.1%
17 1.4%
18 0.2%
19 0.0%
3 0.0%
4 0.0%
5 0.1%
6 1.0%
7 4.4%
8 13.8%
9 27.2%
10 31.2%
11 17.9%
12 3.5%
13 0.8%
14 0.1%
UMN 2 0.0%
3 0.3%
4 2.1%
5 7.5%
6 19.3%
7 25.8%
8 15.3%
9 10.1%
10 8.3%
11 6.0%
12 3.7%
13 1.6%
14 0.1%
15 0.0%
7 0.0%
8 0.1%
9 1.0%
10 7.0%
11 20.6%
12 37.8%
13 30.8%
14 2.7%
15 0.1%
2 0.0%
3 0.4%
4 2.3%
5 8.1%
6 21.0%
7 28.0%
8 16.6%
9 10.7%
10 7.8%
11 4.1%
12 1.1%
13 0.0%
Maine 2 0.0%
3 0.0%
4 0.1%
5 0.5%
6 2.1%
7 5.5%
8 11.7%
9 16.1%
10 14.4%
11 11.6%
12 10.3%
13 8.7%
14 9.2%
15 5.7%
16 3.0%
17 0.9%
18 0.2%
19 0.0%
20 0.0%
21 0.0%
11 0.2%
12 3.7%
13 15.8%
14 32.6%
15 27.6%
16 14.6%
17 4.5%
18 1.0%
19 0.1%
20 0.0%
21 0.0%
2 0.0%
3 0.0%
4 0.1%
5 0.9%
6 3.6%
7 9.6%
8 20.4%
9 28.0%
10 23.1%
11 10.6%
12 3.2%
13 0.5%
Denver 1 0.0%
2 0.0%
3 0.1%
4 0.5%
5 1.3%
6 3.2%
7 6.5%
8 11.9%
9 17.6%
10 19.3%
11 16.3%
12 11.9%
13 7.1%
14 2.4%
15 1.3%
16 0.5%
17 0.1%
9 0.0%
10 1.7%
11 12.3%
12 27.8%
13 28.7%
14 16.0%
15 9.3%
16 3.7%
17 0.5%
1 0.0%
2 0.0%
3 0.1%
4 0.7%
5 1.9%
6 4.6%
7 9.5%
8 17.2%
9 25.2%
10 25.2%
11 13.5%
12 2.1%
UND 10 0.0%
11 0.2%
12 3.5%
13 16.5%
14 34.3%
15 29.1%
16 13.6%
17 2.8%
n/a n/a
Notre Dame 8 0.0%
9 0.0%
10 0.1%
11 1.2%
12 4.9%
13 8.7%
14 9.6%
15 7.9%
16 6.3%
17 10.2%
18 20.9%
19 25.7%
20 4.4%
21 0.1%
15 0.0%
16 0.2%
17 5.2%
18 25.1%
19 56.5%
20 12.6%
21 0.4%
8 0.0%
9 0.0%
10 0.4%
11 3.2%
12 13.4%
13 23.9%
14 26.4%
15 21.0%
16 10.6%
17 1.0%
Western Michigan 11 0.1%
12 0.7%
13 5.1%
14 12.6%
15 16.1%
16 14.6%
17 8.7%
18 5.0%
19 14.3%
20 20.7%
21 2.2%
22 0.0%
17 0.0%
18 4.3%
19 28.1%
20 59.2%
21 8.3%
22 0.1%
11 0.1%
12 1.2%
13 9.0%
14 22.0%
15 28.3%
16 25.3%
17 13.3%
18 0.7%
19 0.0%
Northern Michigan 13 0.3%
14 4.4%
15 20.8%
16 31.5%
17 25.8%
18 13.8%
19 3.4%
20 0.1%
21 0.0%
n/a n/a
Merrimack 6 0.0%
7 0.0%
8 0.1%
9 1.0%
10 4.2%
11 9.9%
12 11.8%
13 10.3%
14 5.0%
15 3.0%
16 7.4%
17 14.8%
18 16.3%
19 11.6%
20 3.8%
21 0.8%
22 0.1%
23 0.0%
14 0.0%
15 0.2%
16 2.2%
17 12.4%
18 34.1%
19 35.6%
20 12.4%
21 2.8%
22 0.3%
23 0.0%
6 0.0%
7 0.0%
8 0.3%
9 2.3%
10 9.8%
11 23.2%
12 27.7%
13 24.0%
14 10.9%
15 1.9%
16 0.0%
Union 2 0.0%
3 0.3%
4 1.3%
5 4.3%
6 11.0%
7 21.7%
8 24.7%
9 14.9%
10 10.1%
11 6.6%
12 3.7%
13 1.1%
14 0.1%
15 0.0%
7 0.0%
8 0.6%
9 4.4%
10 13.5%
11 28.6%
12 32.8%
13 16.7%
14 3.1%
15 0.4%
2 0.0%
3 0.3%
4 1.5%
5 4.8%
6 12.2%
7 24.1%
8 27.2%
9 15.8%
10 9.2%
11 3.9%
12 0.8%
13 0.0%
14 0.0%
Lake Superior 14 0.0%
15 0.5%
16 4.1%
17 12.2%
18 15.7%
19 12.4%
20 11.1%
21 11.6%
22 14.4%
23 11.7%
24 5.0%
25 1.2%
26 0.1%
18 0.0%
19 0.1%
20 1.8%
21 10.4%
22 34.1%
23 34.1%
24 15.3%
25 3.8%
26 0.4%
14 0.0%
15 1.1%
16 9.6%
17 28.3%
18 36.0%
19 20.4%
20 3.8%
21 0.8%
22 0.1%
23 0.0%
Ohio State 18 0.3%
19 6.6%
20 24.0%
21 33.4%
22 24.4%
23 9.9%
24 1.5%
25 0.1%
n/a n/a
CC 13 0.0%
14 0.3%
15 3.5%
16 11.7%
17 18.6%
18 21.8%
19 17.4%
20 6.9%
21 10.2%
22 6.6%
23 2.3%
24 0.7%
25 0.1%
18 0.7%
19 4.3%
20 17.2%
21 33.5%
22 27.4%
23 11.9%
24 4.3%
25 0.7%
13 0.0%
14 0.4%
15 5.0%
16 16.7%
17 26.6%
18 30.4%
19 20.2%
20 0.7%
21 0.0%
Cornell 4 0.0%
5 0.0%
6 0.1%
7 0.4%
8 1.8%
9 5.0%
10 10.5%
11 17.2%
12 21.1%
13 13.7%
14 7.4%
15 4.5%
16 5.3%
17 5.6%
18 5.0%
19 2.3%
20 0.1%
13 0.0%
14 0.5%
15 4.9%
16 16.0%
17 27.6%
18 31.7%
19 18.4%
20 0.8%
4 0.0%
5 0.0%
6 0.1%
7 0.5%
8 2.3%
9 6.4%
10 13.6%
11 22.1%
12 27.2%
13 17.2%
14 8.3%
15 1.9%
16 0.3%
17 0.0%
Northeastern 23 0.0%
24 0.1%
25 1.7%
26 9.1%
27 22.4%
28 29.7%
29 23.3%
30 10.5%
31 2.7%
32 0.5%
33 0.1%
34 0.0%
n/a n/a
SCSU 19 0.0%
20 0.2%
21 2.2%
22 9.5%
23 14.8%
24 14.4%
25 12.6%
26 7.3%
27 5.3%
28 6.6%
29 5.8%
30 5.3%
31 6.1%
32 4.7%
33 1.5%
34 0.1%
Non-TUC 3.6%
27 0.0%
28 0.2%
29 2.5%
30 13.1%
31 30.4%
32 25.6%
33 8.1%
34 0.6%
Non-TUC 19.6%
19 0.0%
20 0.4%
21 3.6%
22 15.7%
23 24.5%
24 23.8%
25 20.6%
26 9.7%
27 1.7%
28 0.0%
Bemidji State 20 0.0%
21 0.4%
22 4.1%
23 23.2%
24 35.9%
25 26.2%
26 9.9%
27 0.3%
28 0.0%
n/a n/a
UW 17 0.0%
18 0.3%
19 2.8%
20 9.0%
21 8.7%
22 7.0%
23 5.6%
24 4.5%
25 8.3%
26 14.1%
27 13.1%
28 11.1%
29 9.1%
30 4.8%
31 1.3%
32 0.2%
33 0.0%
34 0.0%
22 0.1%
23 0.6%
24 1.2%
25 2.6%
26 11.0%
27 20.0%
28 25.8%
29 22.8%
30 12.2%
31 3.2%
32 0.4%
33 0.0%
34 0.0%
17 0.0%
18 1.0%
19 8.9%
20 29.1%
21 27.1%
22 19.1%
23 10.8%
24 3.5%
25 0.4%
26 0.0%
Massachusetts 20 0.0%
21 0.0%
22 0.2%
23 0.6%
24 1.1%
25 2.7%
26 4.4%
27 3.4%
28 2.5%
29 4.9%
30 9.8%
31 7.9%
32 2.7%
33 0.7%
34 0.1%
35 0.0%
Non-TUC 59.1%
Non-TUC 100.0% 20 0.0%
21 0.2%
22 1.4%
23 4.1%
24 8.1%
25 19.8%
26 32.3%
27 23.3%
28 8.7%
29 1.8%
30 0.3%
31 0.0%
32 0.0%
New Hampshire 23 0.0%
24 0.0%
25 0.8%
26 3.6%
27 6.1%
28 5.4%
29 3.6%
30 2.7%
31 3.1%
32 3.0%
33 0.7%
34 0.0%
Non-TUC 70.8%
Non-TUC 100.0% 23 0.0%
24 0.2%
25 3.7%
26 16.6%
27 28.0%
28 24.9%
29 15.5%
30 7.7%
31 2.6%
32 0.6%
33 0.1%
34 0.0%
Nebraska-Omaha 23 0.0%
24 0.0%
25 0.2%
26 0.9%
27 2.7%
28 4.7%
29 7.8%
30 7.2%
31 7.1%
32 5.8%
33 2.5%
34 0.5%
35 0.0%
Non-TUC 60.6%
Non-TUC 100.0% 23 0.0%
24 0.0%
25 0.4%
26 2.4%
27 6.7%
28 11.9%
29 19.7%
30 18.2%
31 17.9%
32 14.7%
33 6.2%
34 1.2%
35 0.1%
Non-TUC 0.5%
Harvard 17 0.0%
18 0.2%
19 2.0%
20 10.2%
21 10.3%
22 10.9%
23 11.4%
24 12.6%
25 9.8%
26 7.6%
27 6.0%
28 2.7%
29 2.6%
30 5.6%
31 5.8%
32 2.2%
33 0.2%
34 0.0%
26 0.0%
27 0.1%
28 2.0%
29 13.7%
30 34.3%
31 35.7%
32 13.3%
33 0.9%
34 0.0%
17 0.0%
18 0.2%
19 3.1%
20 15.9%
21 16.1%
22 17.0%
23 17.7%
24 18.5%
25 10.0%
26 1.5%
27 0.0%
Alaska Non-TUC 100.0% n/a n/a
Providence Non-TUC 100.0% Non-TUC 100.0% Non-TUC 100.0%
MTech Non-TUC 100.0% Non-TUC 100.0% Non-TUC 100.0%
Quinnipiac 16 0.0%
17 0.1%
18 0.5%
19 1.2%
20 4.0%
21 6.5%
22 10.2%
23 11.4%
24 10.6%
25 9.3%
26 9.7%
27 10.6%
28 9.6%
29 8.9%
30 5.2%
31 1.7%
32 0.5%
33 0.1%
34 0.0%
24 0.1%
25 1.1%
26 3.8%
27 9.9%
28 21.9%
29 32.9%
30 20.8%
31 6.9%
32 2.0%
33 0.4%
34 0.0%
16 0.0%
17 0.1%
18 1.0%
19 2.5%
20 8.0%
21 12.9%
22 20.3%
23 22.6%
24 20.1%
25 11.0%
26 1.5%
27 0.0%
Colgate 18 0.0%
19 0.3%
20 5.6%
21 13.5%
22 12.6%
23 8.7%
24 6.6%
25 4.6%
26 4.2%
27 6.1%
28 7.8%
29 7.1%
30 9.1%
31 8.8%
32 3.5%
33 0.8%
34 0.1%
Non-TUC 0.7%
25 0.0%
26 0.1%
27 0.7%
28 3.4%
29 13.0%
30 29.1%
31 33.6%
32 13.8%
33 3.1%
34 0.2%
Non-TUC 2.9%
18 0.0%
19 0.6%
20 11.2%
21 27.1%
22 25.2%
23 17.1%
24 12.0%
25 6.0%
26 0.6%
27 0.2%
28 0.0%
Bowling Green Non-TUC 100.0% Non-TUC 100.0% Non-TUC 100.0%
Yale 23 0.0%
24 0.2%
25 1.4%
26 3.4%
27 4.6%
28 3.9%
29 4.0%
30 5.5%
31 6.4%
32 4.1%
33 1.6%
34 0.5%
35 0.1%
Non-TUC 64.3%
Non-TUC 100.0% 23 0.1%
24 0.7%
25 3.8%
26 9.5%
27 12.9%
28 11.0%
29 11.2%
30 15.5%
31 17.9%
32 11.4%
33 4.5%
34 1.3%
35 0.1%
Dartmouth Non-TUC 100.0% Non-TUC 100.0% Non-TUC 100.0%
St. Lawrence Non-TUC 100.0% n/a n/a
Mankato Non-TUC 100.0% Non-TUC 100.0% Non-TUC 100.0%
Clarkson Non-TUC 100.0% n/a n/a
Air Force 22 0.0%
23 0.4%
24 6.9%
25 20.9%
26 23.8%
27 14.3%
28 6.1%
29 2.5%
30 0.7%
31 0.5%
32 0.7%
33 0.5%
34 0.2%
35 0.0%
Non-TUC 22.5%
Non-TUC 100.0% 22 0.0%
23 0.5%
24 9.1%
25 27.7%
26 31.6%
27 19.0%
28 8.0%
29 3.3%
30 0.7%
31 0.0%
RIT 23 0.0%
24 0.0%
25 0.2%
26 1.4%
27 3.8%
28 6.0%
29 11.1%
30 16.2%
31 13.8%
32 11.4%
33 6.0%
34 1.6%
35 0.2%
Non-TUC 28.6%
Non-TUC 100.0% 23 0.0%
24 0.0%
25 0.2%
26 1.9%
27 5.2%
28 8.4%
29 15.5%
30 22.6%
31 19.3%
32 15.9%
33 8.3%
34 2.3%
35 0.3%
Non-TUC 0.0%
Niagara 24 0.0%
25 0.1%
26 0.4%
27 1.4%
28 3.9%
29 8.8%
30 13.0%
31 15.2%
32 11.6%
33 5.9%
34 1.4%
35 0.1%
Non-TUC 38.3%
Non-TUC 100.0% 24 0.0%
25 0.1%
26 0.7%
27 2.3%
28 6.3%
29 14.2%
30 21.0%
31 24.6%
32 18.7%
33 9.5%
34 2.3%
35 0.2%
Non-TUC 0.0%
AA Non-TUC 100.0% Non-TUC 100.0% Non-TUC 100.0%
Princeton Non-TUC 100.0% n/a n/a
Rensselaer Non-TUC 100.0% Non-TUC 100.0% Non-TUC 100.0%
Mercyhurst Non-TUC 100.0% Non-TUC 100.0% Non-TUC 100.0%
Holy Cross Non-TUC 100.0% Non-TUC 100.0% Non-TUC 100.0%
Robert Morris Non-TUC 100.0% Non-TUC 100.0% Non-TUC 100.0%
Vermont Non-TUC 100.0% n/a n/a
Brown Non-TUC 100.0% n/a n/a
Bentley Non-TUC 100.0% Non-TUC 100.0% Non-TUC 100.0%
Connecticut Non-TUC 100.0% Non-TUC 100.0% Non-TUC 100.0%
Canisius Non-TUC 100.0% n/a n/a
Alabama-Huntsville Non-TUC 100.0% n/a n/a
American Int’l Non-TUC 100.0% n/a n/a
Army Non-TUC 100.0% n/a n/a
Sacred Heart Non-TUC 100.0% n/a n/a

This is probably the last time this season I’ll publish the entire NCAA. Next week I’ll pare it down to those within sight of making the NCAA tournament.

Methodology

Each forecast is based on at least one million monte carlo simulations of the games in the described period. For each simulation, the PairWise Ranking (PWR) is calculated and the results tallied. The probabilities presented in the forecasts are the share of simulations in which a particular outcome occurred.

The outcome of each game in each simulation is determined by random draw, with the probability of victory for each team set by their relative KRACH ratings. So, if the simulation set included a contest between team A with KRACH 300 and team B with KRACH 100, team A will win the game in very close to 75% of the simulations.

Resources

Weekend Preview: North Dakota vs. MSU-Mankato

On the surface, it looks like Troy Jutting’s Mavericks are playing better in the second half after a dismal 3-12-1 start to the season. Mankato has picked up points in six consecutive weekends of WCHA play, going 6-5-1 in those twelve games.

But there’s another way to look at the “tale of two seasons” for MSU-M. The Mavs have fared well against the other teams in the bottom six (St. Cloud State, Wisconsin, Bemidji State, Michigan Tech, and Alaska Anchorage), forging a record of 7-6-1. Mankato hasn’t yet played North Dakota, but has struggled against the others in the top six (Minnesota, Minnesota-Duluth, Denver, Colorado College, and Nebraska-Omaha), winning just once in 12 games (1-10-1).

Minnesota State-Mankato has been led by their freshman class. The seven first-year skaters have scored 31 goals and added 51 assists for 82 points in 164 games played, an average of .5 points per game for the entire class.

By contrast, North Dakota’s nine rookie skaters have netted 27 goals and chipped in 38 helpers for 65 total points in 229 games played for an average of .28 points per game.

UND’s second half resurgence has been helped by junior forward Carter Rowney, who has netted 16 goals this season, eight during the month of February alone.

North Dakota will be unable to field a full complement of players for this weekend’s action, as sophomore forward Taylor Dickin (lower body injury) joins a long list of injured Sioux players. North Dakota will dress nine forwards and eight defensemen for the two game series, with blueliners Joe Gleason and Dan Senkbeil playing up front. Despite the injuries, UND is 14-5-2 (.714) in their last 21 games.

Dave Hakstol’s team has secured home ice for the first round of the WCHA playoffs and sits squarely on the bubble for the NCAA tournament. Anything less than a sweep this weekend would be devastating for North Dakota’s postseason chances.

MSU-Mankato Team Profile

Head Coach: Troy Jutting (12th season at MSUM, 184-220-55, .461)
Pairwise Ranking: NR
National Rankings: NR
This Season: 12-20-2 overall, 8-16-2 WCHA (11th)
Last Season: 14-18-6, 8-16-4 WCHA (11th)

Team Offense: 2.79 goals scored/game
Team Defense: 3.38 goals allowed/game
Power Play: 20.4% (33 of 162)
Penalty Kill: 79.3% (130 of 164)

Key Players: Freshman F Jean-Paul Lafontaine (13-15-28), Freshman F Matt Leitner (9-18-27), Senior F Michael Dorr (8-10-18), Freshman D Zach Palmquist (6-12-18), Junior D Evan Mosey (2-8-10), Senior G Austin Lee (5-13-1, 3.20 GAA, .905 SV%, 1 SO)

North Dakota Team Profile

Head Coach: Dave Hakstol (8th season at UND, 205-105-30, .647)
Pairwise Ranking: 14th
National Rankings: #14/#15
This Season: 18-12-3 overall, 14-11-1 WCHA (4th)
Last Season: 32-9-3 overall (NCAA Frozen Four semifinalist), 21-6-1 WCHA (1st)

Team Offense: 3.06 goals scored/game
Team Defense: 2.79 goals allowed/game
Power Play: 21.7% (33 of 152)
Penalty Kill: 80.7% (113 of 140)

Key Players: Junior F Danny Kristo (15-21-36) Junior F Corban Knight (12-20-32), Sophomore F Brock Nelson (22-16-38), Freshman D Nick Mattson (5-11-16), Senior D Ben Blood (2-14-16), Senior G Brad Eidsness (6-3-1, 2.30 GAA, .914 SV%)

By The Numbers

Last Meeting: December 12, 2010 (Mankato, MN). In a rare Sunday afternoon contest, UND again rallied from an early deficit to secure the road victory, 4-2. Down one goal late in the game, the Mavericks couldn’t capitalize on nearly two minutes of 5 on 3 play, and North Dakota forward Evan Trupp iced the contest with an empty-netter in the final minute. On Friday night, the Green and White scored three 3rd period goals in under three minutes to come back and win 4-3.

Last Meeting in Grand Forks: January 9, 1010. North Dakota got two goals from Jason Gregoire for the second consecutive game and completed the sweep of the visiting Mavs, 3-2. The Fighting Sioux won Friday’s opener, 4-1. The game also marked junior forward Matt Frattin’s return to the lineup after serving a first-half suspension.

All-time Series: UND leads the all-time series, 35-10-7 (.740), including a 21-6-3 (.750) record in games played in Grand Forks.

Last ten: North Dakota has a sparkling 9-1-0 (.900) record in the last ten contests, and has lost just once in the last 18 meetings (16-1-1).

Game News and Notes

UND head coach Dave Hakstol is 20-3-2 (.840) against the Mavericks in his career. MSU-Mankato is just 1-11-1 when trailing after the opening period of play. North Dakota is 12-4-3 at home this season, but three of those four losses were by four goals (Boston College, Minnesota, St. Cloud State).

The Prediction

North Dakota is just 8-5-1 against the bottom six teams in the league, but they’ll add two wins to that total this weekend. UND will struggle in Saturday’s rematch, but special teams will be key. UND 5-2, 3-2.

Sioux hosting Minnesota State in a nearly must-win situation

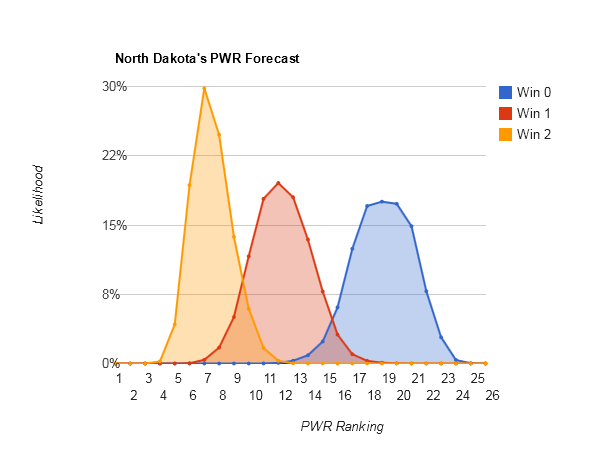
UND continues to keep things interesting by doing just what it needs to do to keep its playoff hopes alive, but no more. A split last weekend left UND at #14 in the PairWise Rankings (PWR) and a good shot at making the NCAA tournament. The Sioux need a sweep this weekend to hold steady or rise slightly, anything less is likely to lead to a fall.

The PWR has played out pretty much as expected this Spring. If you look back at A first look at the PairWise Rankings and UND’s tournament possibilities from January 3, I forecast that the Sioux would need to win 11 of 15 to be confidently above #13 at the end of the regular season. Since then, the Sioux are 8-4-1 with 2 games remaining in the regular season, and this week’s forecast confirms that 2 more wins are needed to stand a good shot of finishing ranked #13 or above.

Probability of UND ending the regular season with a particular PWR rank or higher based on UND’s performance
Win 0 Win 1 Win 2
1 0.00% 0.00% 0.00%
2 0.00% 0.00% 0.00%
3 0.00% 0.00% 0.00%
4 0.00% 0.00% 0.00%
5 0.00% 0.00% 0.00%
6 0.00% 0.00% 0.00%
7 0.00% 0.00% 0.00%
8 0.00% 0.00% 0.00%
9 0.00% 0.00% 0.01%
10 0.00% 0.00% 0.33%
11 0.00% 0.00% 6.92%
12 0.00% 0.14% 24.24%
13 0.00% 2.49% 63.34%
14 0.10% 18.08% 94.57%
15 2.03% 54.65% 98.93%
16 14.01% 88.64% 100.00%
17 45.51% 100.00% 100.00%
18 99.97% 100.00% 100.00%
19 100.00% 100.00% 100.00%
20 100.00% 100.00% 100.00%

The good news is that even with a split this weekend UND fans won’t have to abandon all hope. A split would leave UND with a better than 50% chance of being #15 or above and an 89% chance of being #16 or above. A good conference tournament could certainly push UND into NCAA tournament position from there.

Who to cheer for this weekend

Other than UND’s own matchup, these are the games that most improve UND’s outcomes.

If UND sweeps:

  • New Hampshire over Maine
  • Nebraska-Omaha over Denver (sweep)
  • Bowling Green over N. Michigan (at least one)

If UND splits:

  • Notre Dame over Ohio St (at least one)
  • Massachusetts over Merrimack (sweep)
  • Bowling Green over N. Michigan (sweep)

If UND is swept:

  • Massachusetts over Merrimack (sweep)

I may relabel these in future posts, because they’re clearly split into offensive (comparisons UND is losing but can flip) and defensive (comparisons UND is winning but could lose). The offensive moves are those that help us most if we win — the Sioux could take the comparisons with Maine, Denver, and Northern Michigan if we win and they lose. The defensive moves are those that help us most if we lose — the Sioux want to hold onto the comparisons with Ohio St. and Merrimack by them losing.

A look around the WCHA

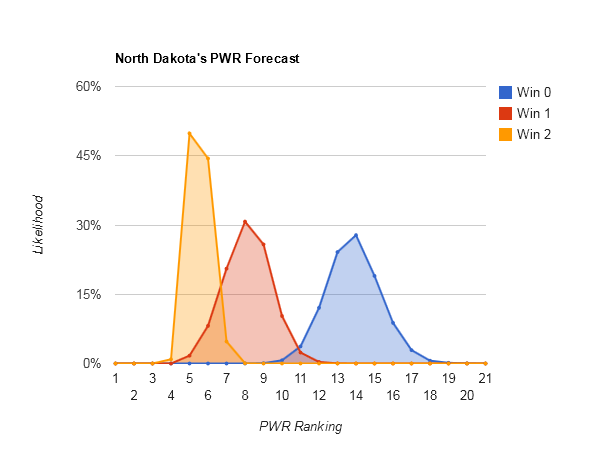
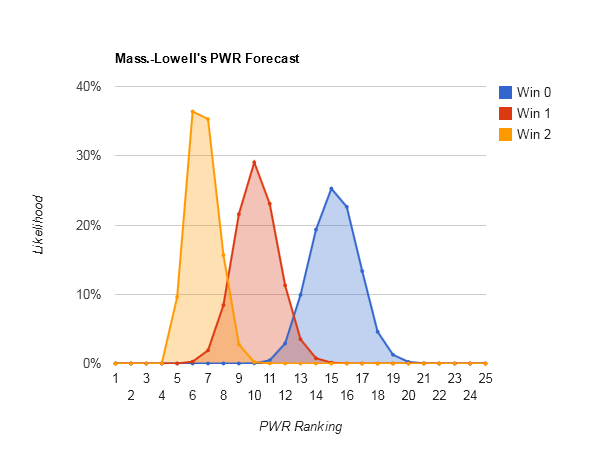
Minnesota, while not quite locked up, is sure in control of it’s own destiny.

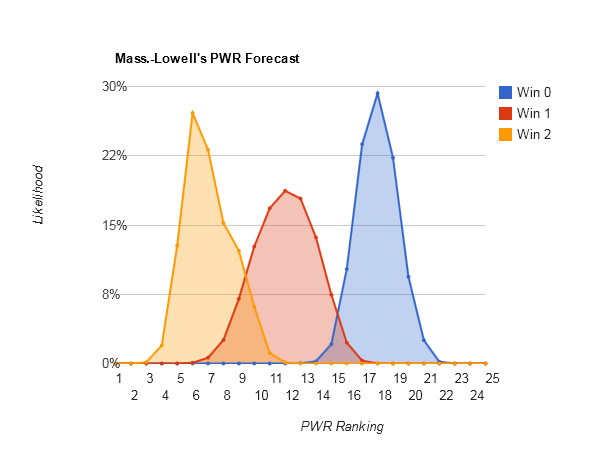
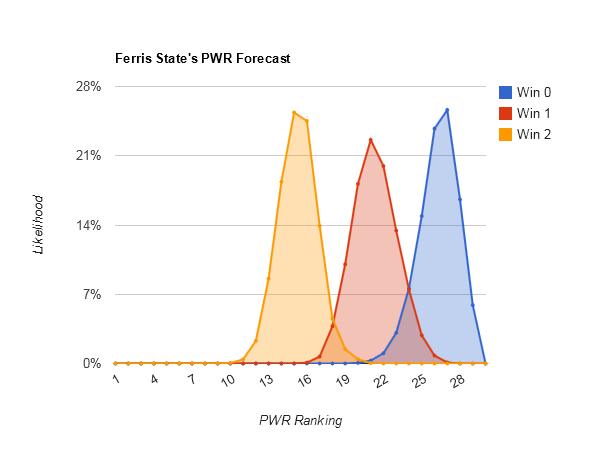
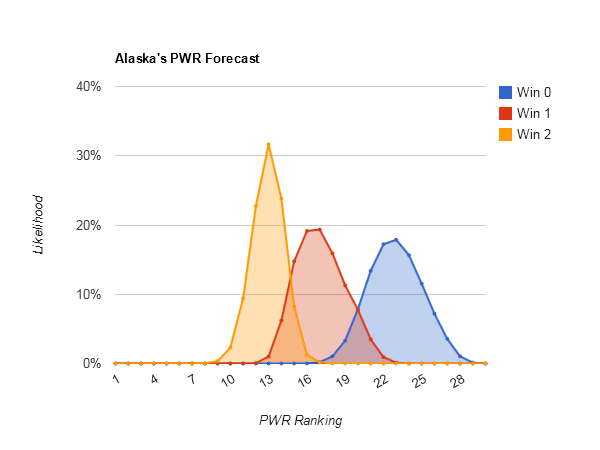
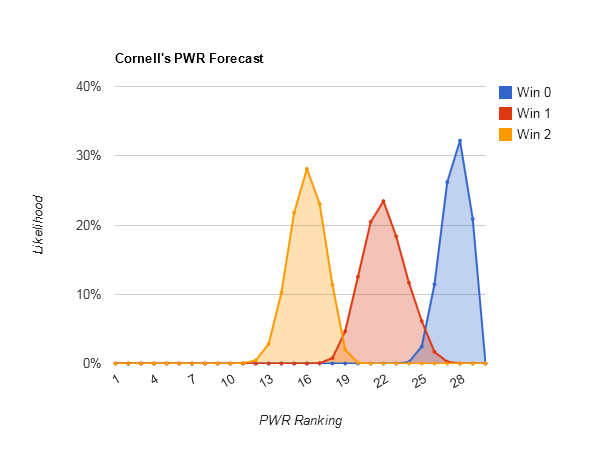
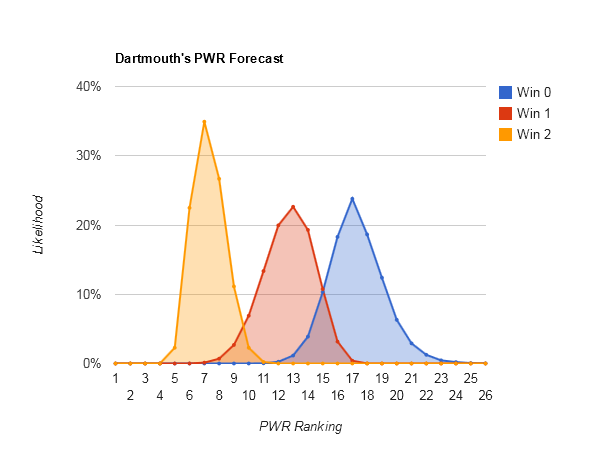
Denver’s split also resulted in a chart that looks a lot like last week’s, but with the win 0 and win 4 chopped off, due to the split.

And unfortunately for CC, getting swept leaves their chart looking a lot like last week’s, but with the win 3 and win 4 chopped off. The Tigers hopes aren’t dead yet, but they’re fading fast.

A look around the NCAA

Finally, this one is big, here are the likelihoods of each each NCAA team having each PWR ranking after this weekend.

Team Mar. 5 PWR Possibilities
Overall Win none Win all
Boston College 1 24.4%
2 60.1%
3 8.9%
4 4.8%
5 1.7%
6 0.1%
7 0.0%
8 0.0%
1 0.5%
2 1.7%
3 15.4%
4 44.6%
5 34.8%
6 2.8%
7 0.2%
8 0.1%
1 25.5%
2 65.1%
3 7.4%
4 1.8%
5 0.2%
6 0.0%
Michigan 1 4.3%
2 22.2%
3 70.1%
4 3.3%
5 0.2%
6 0.0%
n/a n/a
Ferris State 1 0.2%
2 2.2%
3 10.8%
4 51.8%
5 30.4%
6 4.6%
7 0.0%
n/a n/a
UMD 1 71.0%
2 14.0%
3 2.8%
4 2.1%
5 2.6%
6 3.2%
7 3.1%
8 0.9%
9 0.3%
10 0.1%
11 0.0%
1 0.0%
2 0.1%
3 0.4%
4 3.3%
5 14.8%
6 31.6%
7 35.1%
8 10.0%
9 3.6%
10 0.8%
11 0.2%
1 93.0%
2 6.9%
3 0.0%
Boston University 1 0.2%
2 1.4%
3 5.6%
4 23.2%
5 34.0%
6 19.1%
7 6.5%
8 0.6%
9 1.4%
10 2.4%
11 3.1%
12 2.4%
13 0.1%
14 0.0%
5 0.0%
6 0.3%
7 2.4%
8 5.9%
9 13.2%
10 23.6%
11 30.1%
12 23.8%
13 0.7%
14 0.0%
1 0.5%
2 3.0%
3 12.1%
4 47.0%
5 37.3%
6 0.1%
7 0.0%
Miami 3 0.0%
4 0.0%
5 1.2%
6 8.3%
7 21.4%
8 30.4%
9 29.8%
10 8.8%
11 0.0%
12 0.0%
n/a n/a
Michigan State 5 0.0%
6 0.1%
7 1.0%
8 5.9%
9 23.0%
10 35.9%
11 23.3%
12 10.4%
13 0.5%
14 0.0%
n/a n/a
UMN 2 0.0%
3 0.0%
4 1.3%
5 14.2%
6 37.4%
7 29.5%
8 4.6%
9 1.3%
10 1.2%
11 3.1%
12 3.3%
13 2.4%
14 0.7%
15 0.5%
16 0.4%
17 0.1%
18 0.0%
19 0.0%
7 0.0%
8 0.2%
9 0.9%
10 8.8%
11 26.0%
12 27.7%
13 20.6%
14 6.2%
15 4.8%
16 3.8%
17 0.7%
18 0.3%
19 0.0%
2 0.0%
3 0.0%
4 2.7%
5 27.4%
6 50.3%
7 18.5%
8 0.8%
9 0.2%
10 0.0%
11 0.0%
Mass.-Lowell 2 0.1%
3 1.8%
4 13.6%
5 15.5%
6 23.9%
7 18.1%
8 8.0%
9 5.7%
10 2.9%
11 4.0%
12 2.4%
13 1.7%
14 1.1%
15 0.8%
16 0.4%
17 0.1%
18 0.0%
19 0.0%
6 0.0%
7 0.0%
8 0.4%
9 2.6%
10 9.7%
11 16.2%
12 21.3%
13 20.0%
14 12.7%
15 9.8%
16 5.2%
17 1.7%
18 0.2%
19 0.0%
2 0.1%
3 3.5%
4 26.8%
5 27.9%
6 29.7%
7 11.7%
8 0.3%
Northern Michigan 5 0.0%
6 0.0%
7 0.1%
8 1.2%
9 5.7%
10 15.5%
11 26.4%
12 17.0%
13 9.8%
14 7.7%
15 3.9%
16 4.1%
17 3.6%
18 4.8%
19 0.2%
20 0.0%
13 0.0%
14 0.0%
15 0.4%
16 6.0%
17 26.5%
18 64.0%
19 2.8%
20 0.2%
5 0.0%
6 0.0%
7 0.2%
8 1.4%
9 6.5%
10 17.7%
11 30.2%
12 19.4%
13 11.2%
14 8.7%
15 3.2%
16 1.5%
17 0.0%
Maine 5 0.0%
6 0.0%
7 0.3%
8 1.6%
9 8.2%
10 22.8%
11 21.0%
12 14.4%
13 9.3%
14 9.8%
15 5.8%
16 5.3%
17 1.2%
18 0.4%
19 0.0%
8 0.0%
9 0.1%
10 0.6%
11 2.1%
12 11.3%
13 21.1%
14 28.0%
15 16.8%
16 15.4%
17 3.5%
18 1.1%
19 0.0%
5 0.0%
6 0.0%
7 0.5%
8 2.5%
9 12.4%
10 34.4%
11 30.8%
12 16.1%
13 3.0%
14 0.2%
15 0.0%
UND 9 0.0%
10 0.2%
11 3.8%
12 10.2%
13 23.7%
14 23.9%
15 15.8%
16 13.5%
17 5.9%
18 3.0%
19 0.0%
14 0.1%
15 1.9%
16 12.1%
17 31.4%
18 54.5%
19 0.0%
9 0.0%
10 0.3%
11 6.5%
12 17.3%
13 39.2%
14 31.2%
15 4.4%
16 1.1%
Western Michigan 13 0.0%
14 0.3%
15 4.1%
16 27.6%
17 48.7%
18 19.3%
19 0.1%
n/a n/a
Denver 6 0.0%
7 0.0%
8 0.1%
9 0.8%
10 4.3%
11 13.6%
12 32.8%
13 31.8%
14 6.2%
15 5.3%
16 3.7%
17 0.9%
18 0.6%
19 0.0%
20 0.0%
11 0.0%
12 0.2%
13 5.2%
14 16.1%
15 37.7%
16 29.0%
17 7.2%
18 4.7%
19 0.0%
20 0.0%
6 0.0%
7 0.0%
8 0.2%
9 1.9%
10 9.6%
11 23.8%
12 36.3%
13 26.5%
14 1.5%
15 0.1%
16 0.0%
Merrimack 9 0.0%
10 0.1%
11 1.1%
12 3.8%
13 5.9%
14 10.7%
15 13.8%
16 20.5%
17 13.8%
18 23.5%
19 2.6%
20 1.9%
21 1.6%
22 0.5%
23 0.0%
24 0.0%
25 0.0%
15 0.0%
16 0.0%
17 1.6%
18 57.8%
19 10.3%
20 13.7%
21 12.4%
22 3.8%
23 0.3%
24 0.0%
25 0.0%
9 0.0%
10 0.2%
11 2.8%
12 9.2%
13 13.3%
14 20.7%
15 18.3%
16 12.7%
17 10.2%
18 11.2%
19 1.4%
20 0.0%
Notre Dame 11 0.0%
12 0.0%
13 0.1%
14 1.0%
15 3.0%
16 6.2%
17 14.9%
18 27.1%
19 11.7%
20 20.1%
21 11.0%
22 4.0%
23 0.9%
24 0.0%
17 0.0%
18 1.8%
19 16.0%
20 37.6%
21 27.7%
22 13.4%
23 3.4%
24 0.1%
11 0.0%
12 0.0%
13 0.3%
14 2.0%
15 5.9%
16 12.3%
17 29.3%
18 50.0%
19 0.1%
20 0.0%
Ohio State 10 0.0%
11 0.0%
12 0.2%
13 0.8%
14 3.8%
15 7.5%
16 10.5%
17 10.6%
18 17.2%
19 25.9%
20 17.7%
21 4.6%
22 1.3%
23 0.0%
24 0.0%
18 1.2%
19 39.3%
20 40.1%
21 14.5%
22 4.8%
23 0.2%
24 0.0%
10 0.0%
11 0.0%
12 0.4%
13 1.6%
14 7.6%
15 15.1%
16 21.1%
17 21.5%
18 32.4%
19 0.2%
20 0.0%
Union 3 0.0%
4 0.0%
5 0.2%
6 3.3%
7 20.0%
8 46.7%
9 23.8%
10 5.8%
11 0.2%
12 0.0%
n/a n/a
Lake Superior 17 0.0%
18 1.4%
19 29.4%
20 23.4%
21 15.0%
22 10.5%
23 8.6%
24 6.1%
25 3.5%
26 1.7%
27 0.4%
28 0.0%
29 0.0%
20 0.3%
21 4.0%
22 13.2%
23 24.7%
24 28.0%
25 18.1%
26 9.4%
27 2.1%
28 0.1%
29 0.0%
17 0.0%
18 2.2%
19 45.9%
20 33.6%
21 13.8%
22 4.4%
23 0.1%
24 0.0%
CC 18 2.2%
19 25.8%
20 23.7%
21 25.1%
22 9.5%
23 5.5%
24 4.5%
25 2.5%
26 0.9%
27 0.2%
28 0.0%
29 0.0%
30 0.0%
20 0.2%
21 3.3%
22 21.9%
23 28.9%
24 25.1%
25 14.1%
26 5.1%
27 1.2%
28 0.1%
29 0.0%
30 0.0%
18 6.2%
19 71.4%
20 21.1%
21 1.3%
22 0.1%
Cornell 9 0.0%
10 0.0%
11 0.4%
12 3.2%
13 14.0%
14 34.9%
15 39.6%
16 7.8%
17 0.1%
n/a n/a
UW 16 0.0%
17 0.0%
18 0.2%
19 2.7%
20 6.2%
21 13.6%
22 11.1%
23 6.3%
24 6.5%
25 7.4%
26 6.2%
27 7.4%
28 10.6%
29 11.1%
30 7.4%
31 2.7%
32 0.6%
33 0.1%
34 0.0%
24 0.1%
25 3.3%
26 8.0%
27 15.2%
28 23.7%
29 25.2%
30 16.8%
31 6.2%
32 1.3%
33 0.2%
34 0.0%
16 0.0%
17 0.1%
18 1.7%
19 23.2%
20 37.9%
21 27.4%
22 7.7%
23 1.4%
24 0.3%
25 0.1%
26 0.0%
27 0.0%
Northeastern 18 0.0%
19 0.0%
20 0.2%
21 1.0%
22 1.8%
23 2.2%
24 3.7%
25 8.7%
26 13.1%
27 12.1%
28 7.6%
29 3.1%
30 1.3%
31 1.1%
32 0.7%
33 0.3%
34 0.0%
35 0.0%
Non-TUC 42.9%
26 0.0%
27 0.0%
28 0.2%
29 0.6%
30 1.6%
31 2.3%
32 1.6%
33 0.6%
34 0.1%
35 0.0%
Non-TUC 93.0%
18 0.0%
19 0.1%
20 1.9%
21 10.2%
22 17.7%
23 21.8%
24 24.6%
25 16.0%
26 6.6%
27 1.1%
28 0.1%
29 0.0%
SCSU 17 0.0%
18 0.3%
19 0.9%
20 1.9%
21 2.6%
22 3.3%
23 2.5%
24 4.5%
25 7.7%
26 11.6%
27 9.6%
28 4.9%
29 1.5%
30 1.1%
31 0.6%
32 0.4%
33 0.1%
34 0.0%
35 0.0%
Non-TUC 46.5%
23 0.0%
24 0.0%
25 0.1%
26 0.2%
27 0.4%
28 0.7%
29 1.0%
30 1.7%
31 1.2%
32 0.8%
33 0.2%
34 0.0%
35 0.0%
Non-TUC 93.5%
17 0.5%
18 3.6%
19 10.7%
20 21.6%
21 28.6%
22 28.4%
23 6.0%
24 0.7%
25 0.0%
Bemidji State 22 0.0%
23 0.1%
24 2.0%
25 9.3%
26 19.1%
27 14.0%
28 9.1%
29 12.0%
30 13.3%
31 7.5%
32 2.7%
33 0.7%
34 0.1%
35 0.0%
Non-TUC 10.1%
Non-TUC 100.0% 22 0.0%
23 0.1%
24 4.3%
25 19.8%
26 40.4%
27 27.0%
28 6.8%
29 1.5%
30 0.1%
31 0.0%
New Hampshire 22 0.0%
23 0.0%
24 0.9%
25 4.6%
26 9.0%
27 10.3%
28 7.7%
29 8.5%
30 13.9%
31 14.2%
32 7.9%
33 1.8%
34 0.2%
35 0.0%
Non-TUC 21.0%
25 0.0%
26 0.0%
27 0.2%
28 2.1%
29 9.3%
30 20.0%
31 21.4%
32 12.0%
33 2.8%
34 0.2%
35 0.0%
Non-TUC 32.0%
22 0.0%
23 0.1%
24 2.7%
25 13.4%
26 26.2%
27 29.7%
28 18.2%
29 6.9%
30 2.4%
31 0.4%
32 0.0%
33 0.0%
Alaska 25 0.0%
26 0.0%
27 0.1%
28 0.7%
29 2.2%
30 4.1%
31 4.7%
32 3.4%
33 1.4%
34 0.3%
35 0.0%
36 0.0%
Non-TUC 83.1%
Non-TUC 100.0% 25 0.0%
26 0.0%
27 0.2%
28 1.8%
29 6.0%
30 11.1%
31 12.8%
32 9.1%
33 3.8%
34 0.8%
35 0.1%
36 0.0%
Non-TUC 54.3%
Nebraska-Omaha 20 0.0%
21 0.4%
22 2.6%
23 4.6%
24 3.1%
25 1.3%
26 1.0%
27 6.3%
28 15.7%
29 16.2%
30 5.8%
31 0.8%
32 0.0%
Non-TUC 42.2%
Non-TUC 100.0% 20 0.1%
21 2.9%
22 21.5%
23 37.7%
24 25.2%
25 10.3%
26 1.9%
27 0.3%
28 0.0%
Massachusetts 21 0.0%
22 0.3%
23 1.1%
24 3.0%
25 4.0%
26 2.7%
27 2.5%
28 5.8%
29 12.4%
30 13.8%
31 9.5%
32 3.2%
33 0.6%
34 0.1%
35 0.0%
Non-TUC 41.0%
Non-TUC 100.0% 21 0.1%
22 2.3%
23 8.6%
24 23.3%
25 30.9%
26 21.2%
27 10.7%
28 2.6%
29 0.4%
30 0.0%
31 0.0%
MTech 23 0.0%
24 0.3%
25 1.0%
26 2.3%
27 3.9%
28 4.1%
29 3.1%
30 2.0%
31 0.9%
32 0.2%
33 0.0%
Non-TUC 82.1%
Non-TUC 100.0% 23 0.1%
24 1.6%
25 5.8%
26 12.7%
27 22.0%
28 22.7%
29 17.3%
30 11.4%
31 5.1%
32 1.2%
33 0.0%
Harvard 18 0.0%
19 0.4%
20 3.5%
21 17.9%
22 32.0%
23 24.7%
24 16.9%
25 3.4%
26 1.0%
27 0.1%
28 0.0%
n/a n/a
Providence 25 0.0%
26 0.1%
27 0.4%
28 1.2%
29 2.0%
30 2.3%
31 1.6%
32 0.7%
33 0.1%
34 0.0%
35 0.0%
Non-TUC 91.7%
Non-TUC 100.0% 25 0.1%
26 0.7%
27 4.7%
28 14.4%
29 23.7%
30 27.6%
31 19.1%
32 8.0%
33 1.6%
34 0.2%
35 0.0%
Quinnipiac 18 0.0%
19 0.3%
20 1.4%
21 6.6%
22 16.4%
23 21.2%
24 20.0%
25 13.9%
26 6.4%
27 4.2%
28 3.7%
29 3.0%
30 1.9%
31 0.8%
32 0.2%
33 0.0%
34 0.0%
24 0.1%
25 1.1%
26 5.8%
27 14.4%
28 22.9%
29 24.1%
30 19.4%
31 9.6%
32 2.3%
33 0.3%
34 0.0%
18 0.0%
19 0.3%
20 1.8%
21 8.1%
22 20.1%
23 25.9%
24 24.0%
25 15.2%
26 4.1%
27 0.4%
28 0.0%
29 0.0%
Colgate 20 0.0%
21 0.5%
22 6.6%
23 22.1%
24 27.9%
25 29.2%
26 11.3%
27 2.1%
28 0.2%
29 0.0%
30 0.0%
n/a n/a
Bowling Green Non-TUC 100.0% Non-TUC 100.0% Non-TUC 100.0%
St. Lawrence Non-TUC 100.0% Non-TUC 100.0% Non-TUC 100.0%
Yale 26 0.0%
27 0.1%
28 0.6%
29 2.0%
30 5.0%
31 7.7%
32 6.9%
33 3.6%
34 1.0%
35 0.1%
36 0.0%
Non-TUC 73.1%
Non-TUC 100.0% 26 0.0%
27 0.1%
28 0.9%
29 3.2%
30 8.0%
31 12.3%
32 11.0%
33 5.8%
34 1.5%
35 0.2%
36 0.0%
Non-TUC 57.0%
Mankato Non-TUC 100.0% Non-TUC 100.0% Non-TUC 100.0%
Clarkson Non-TUC 100.0% Non-TUC 100.0% Non-TUC 100.0%
AA Non-TUC 100.0% Non-TUC 100.0% Non-TUC 100.0%
Air Force 23 0.0%
24 0.4%
25 3.4%
26 13.6%
27 26.3%
28 27.4%
29 17.3%
30 8.3%
31 2.8%
32 0.4%
33 0.0%
n/a n/a
RIT 27 0.0%
28 0.0%
29 0.1%
30 0.3%
31 0.3%
32 0.2%
33 0.1%
34 0.0%
35 0.0%
Non-TUC 98.9%
n/a n/a
Niagara Non-TUC 100.0% n/a n/a
Dartmouth Non-TUC 100.0% Non-TUC 100.0% Non-TUC 100.0%
Princeton Non-TUC 100.0% Non-TUC 100.0% Non-TUC 100.0%
Mercyhurst Non-TUC 100.0% n/a n/a
Robert Morris Non-TUC 100.0% Non-TUC 100.0% Non-TUC 100.0%
Holy Cross Non-TUC 100.0% Non-TUC 100.0% Non-TUC 100.0%
Rensselaer Non-TUC 100.0% Non-TUC 100.0% Non-TUC 100.0%
Vermont Non-TUC 100.0% Non-TUC 100.0% Non-TUC 100.0%
Brown Non-TUC 100.0% Non-TUC 100.0% Non-TUC 100.0%
Bentley Non-TUC 100.0% Non-TUC 100.0% Non-TUC 100.0%
Connecticut Non-TUC 100.0% Non-TUC 100.0% Non-TUC 100.0%
Canisius Non-TUC 100.0% Non-TUC 100.0% Non-TUC 100.0%
Alabama-Huntsville Non-TUC 100.0% n/a n/a
American Int’l Non-TUC 100.0% Non-TUC 100.0% Non-TUC 100.0%
Army Non-TUC 100.0% Non-TUC 100.0% Non-TUC 100.0%
Sacred Heart Non-TUC 100.0% Non-TUC 100.0% Non-TUC 100.0%

Three conferences (the AHA, CCHA, and ECAC) are already in their conference playoffs this week playing best-of-three series. For those teams the “win all” column includes all the scenarios in which that team wins two games, combining scenarios in which they go 2-0 with those in which they go 2-1.

Methodology

Each forecast is based on at least one million monte carlo simulations of the games in the described period. For each simulation, the PairWise Ranking (PWR) is calculated and the results tallied. The probabilities presented in the forecasts are the share of simulations in which a particular outcome occurred.

The outcome of each game in each simulation is determined by random draw, with the probability of victory for each team set by their relative KRACH ratings. So, if the simulation set included a contest between team A with KRACH 300 and team B with KRACH 100, team A will win the game in very close to 75% of the simulations.

Resources

Weekend Preview: UND at Denver

In the new National Collegiate Hockey Conference, it is clear that Denver/North Dakota will be at the top of the league rivalries.

The two schools clearly do not like each other, and the feud goes all the way back to Geoff Paukovitch’ illegal check on Sioux forward Robbie Bina during the 2005 WCHA Final Five.

Since that game (a Denver victory), the two teams have met five times in tournament play. Denver won the 2005 NCAA title with a victory over North Dakota and claimed a 2008 WCHA Final Five win as well. UND has won the last three playoff games between the schools, including two consecutive victories in the WCHA Final Five (2010 and 2011) and last season’s NCAA Midwest Regional final which sent the Fighting Sioux to the Frozen Four.

Along the way, we’ve had dasher dances, brawls, and a certain coach losing his way to the visiting locker room. The last time these two teams played in Denver, the referees called 20 penalties.

North Dakota has gone with the same lineup of 18 skaters since a rash of injuries left them with no other options. For Denver, forwards Beau Bennett (injury) and Dan Olszewski (suspension) will not dress, and injured defenseman Dan Makowski is out as well.

The big story for the Pioneers is the return of goaltender Sam Brittain. The sophomore suffered a knee injury against North Dakota in the Final Five last year and lost more than half a season with the Pios and a chance to play for Team Canada in the World Junior Championships.

For North Dakota, the headline is the emergence of forward Carter Rowney. The junior forward has potted 14 goals (2nd on the team) and gives UND a true second line scoring threat. Rowney had four goals over 67 games in his first two seasons.

After losing five out of his first eight games in Denver as head coach of the Fighting Sioux, UND head coach Dave Hakstol has altered his travel schedule. The team arrived in Denver on Wednesday and held a full practice on Thursday in advance of the weekend series.

Across the league, the top six teams in the standings are facing off in weekend action. Minnesota-Duluth (2nd) is hosting Colorado College (t-4th), while Minnesota (1st) travels to Nebraska-Omaha (t-4th). North Dakota (t-4th) could leapfrog Denver (3rd) in the standings with a road sweep.

Denver Team Profile

Head Coach: George Gwozdecky (18th season at DU, 416-249-59 .615)
Pairwise Ranking: t-11th
National Rankings: #9/#10
This Season: 18-10-4 overall, 13-7-4 WCHA (3rd)
Last Season: 25-12-5 Overall (NCAA Midwest Regional Finalist), 17-8-3 WCHA (2nd)

Team Offense: 3.47 goals scored/game
Team Defense: 2.72 goals allowed/game
Power Play: 23.3% (31 of 133)
Penalty Kill: 81.1% (120 of 148)

Key Players: Junior F Drew Shore (18-24-42), Sophomore F Jason Zucker (17-20-37), Sophomore F Nick Shore (10-19-29), Freshman D Joey LaLeggia (10-23-33), Senior D John Lee (3-9-12), Sophomore G Sam Brittain (4-2-0, 2.51 GAA, .923 SV%, 1 SO)

North Dakota Team Profile

Head Coach: Dave Hakstol (8th season at UND, 204-104-30, .648)
Pairwise Ranking: 14th
National Rankings: #14/#12
This Season: 17-11-3 overall, 13-10-1 WCHA (t-4th)
Last Season: 32-9-3 overall (NCAA Frozen Four semifinalist), 21-6-1 WCHA (1st)

Team Offense: 3.03 goals scored/game
Team Defense: 2.71 goals allowed/game
Power Play: 22.2% (32 of 144)
Penalty Kill: 82.3% (107 of 130)

Key Players: Junior F Danny Kristo (14-19-33) Junior F Corban Knight (11-19-30), Sophomore F Brock Nelson (20-15-35), Freshman D Nick Mattson (5-11-16), Senior D Ben Blood (2-12-14), Senior G Brad Eidsness (5-2-1, 1.92 GAA, .926 SV%)

By The Numbers

Last Meeting: March 27, 2011 (Green Bay, WI). North Dakota punched their ticket to the NCAA Frozen Four with a 6-1 victory over Denver. The Pioneers lone goal came with .1 seconds remaining in the opening period. UND also defeated DU in the WCHA Final Five title game one weekend earlier.

Last Meeting in Denver: November 21, 2009. The Pioneers survived a late disallowed goal and a 6-on-3 advantage in the closing seconds to preserve a 3-2 victory and series sweep over visiting North Dakota. DU won the series opener 1-0 on Drew Shore’s power play tally midway through the game.

Most Important Meeting: It’s hard to pick just one game, as the two teams have played four times for the national title. Denver defeated UND for the national championship in 1958, 1968, and 2005, while the Sioux downed the Pioneers in 1963. And just least season, North Dakota defeated Denver in the WCHA Final Five championship and Midwest Regional championship games.

Last Ten Games: Denver has had slight edge lately, going 5-4-1 (.550) in the last ten meetings between the schools. Only two of the last ten games between the teams have taken place in Denver (Grand Forks 5, St. Paul 2, Green Bay 1).

All-time Series: UND leads the all-time series, 133-115-8 (.535), but the Pioneers have had the better of it at altitude, claiming a 66-49-3 (.564) mark in games played in Denver.

Game News and Notes

Friday’s opener can be seen on NBC Sports, with Saturday’s rematch on FSN+. North Dakota has given up the second-fewest goals (62) in league play this season, while Denver has allowed 70 (fifth). UND is attempting to secure home ice in the first round of the WCHA playoffs for the tenth consecutive season, the longest active streak in the league. Denver head coach George Gwozdecky just might squat on the dasher in front of his team’s bench.

The Prediction

The extra day in Denver will help the Green and White earn a split. UND will survive a late Denver onslaught in the opener but will fall in the rematch. UND 3-2, Denver 3-1.

Sioux-Pioneers matchup has playoff implications for both

The #14 UND men’s hockey team continues to do what’s required to keep its NCAA playoff hopes alive, but faces a tough test against the #12 Denver Pioneers, who also find themselves needing a good run to ensure an NCAA playoff bid.

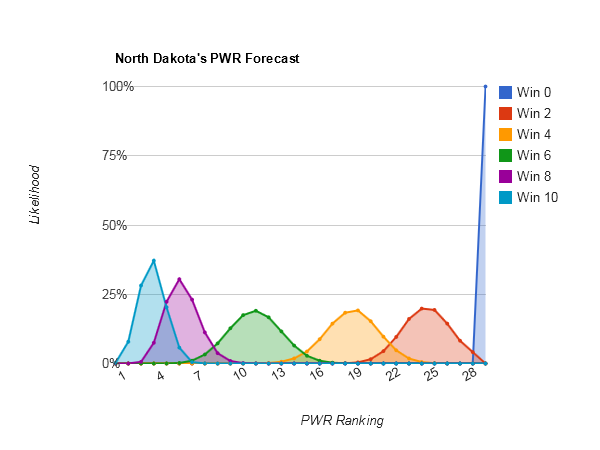
With a win and a tie last weekend, UND can still afford one more loss and still be well-positioned for the NCAA playoffs (#13 or higher in the PWR Rankings) going into conference tournament time. With two or three more losses, UND’s playoff hopes would still be alive, but dependent on a good run in the WCHA tournament.

Probability of UND ending the regular season with a particular PWR rank or higher based on UND’s performance
PWR Win 0 Win 1 Win 2 Win 3 Win 4
1 0.00% 0.00% 0.00% 0.00% 0.00%
2 0.00% 0.00% 0.00% 0.00% 0.00%
3 0.00% 0.00% 0.00% 0.00% 0.01%
4 0.00% 0.00% 0.00% 0.00% 0.25%
5 0.00% 0.00% 0.00% 0.00% 2.35%
6 0.00% 0.00% 0.00% 0.01% 10.75%
7 0.00% 0.00% 0.00% 0.07% 28.09%
8 0.00% 0.00% 0.00% 0.50% 51.64%
9 0.00% 0.00% 0.00% 2.38% 74.58%
10 0.00% 0.00% 0.01% 8.54% 90.66%
11 0.00% 0.00% 0.12% 23.71% 98.18%
12 0.00% 0.00% 1.05% 49.03% 99.97%
13 0.00% 0.01% 5.96% 76.28% 100.00%
14 0.00% 0.21% 21.18% 93.17% 100.00%
15 0.00% 2.62% 49.72% 98.80% 100.00%
16 0.23% 11.96% 78.98% 99.86% 100.00%
17 2.04% 30.27% 94.10% 99.99% 100.00%
18 8.32% 53.23% 98.82% 100.00% 100.00%
19 23.98% 74.92% 99.81% 100.00% 100.00%
20 48.34% 90.09% 99.98% 100.00% 100.00%

With just one more loss, UND would stand about a 76% chance of finishing #13 or higher. With two more losses, that drops to 6%.

UND isn’t alone in watching this weekend’s matchup with keen interest. Denver wants at least two wins in its remaining four regular games to ensure heading into the conference playoffs at #13 or higher, though can afford to slip a little more than UND.

With a sweep last weekend, Minnesota is looking more like a lock for the NCAA tournament.

And CC’s recent struggles have given the Tigers a steep, but doable, hill to climb.

This weekend

UND’s outcome spread for the weekend is tightening up a bit.

Probability of UND ending the regular season with a particular PWR rank or higher based on UND’s performance
PWR Win 0 Win 1 Win 2
1 0.00% 0.00% 0.00%
2 0.00% 0.00% 0.00%
3 0.00% 0.00% 0.00%
4 0.00% 0.00% 0.01%
5 0.00% 0.00% 0.13%
6 0.00% 0.00% 1.51%
7 0.00% 0.00% 7.74%
8 0.00% 0.00% 23.03%
9 0.00% 0.00% 46.96%
10 0.00% 0.08% 74.56%
11 0.00% 1.10% 93.94%
12 0.00% 8.02% 99.78%
13 0.23% 33.01% 100.00%
14 2.64% 68.60% 100.00%
15 13.38% 91.72% 100.00%
16 40.17% 98.83% 100.00%
17 68.82% 99.92% 100.00%
18 87.60% 100.00% 100.00%
19 96.54% 100.00% 100.00%
20 99.42% 100.00% 100.00%
21 99.94% 100.00% 100.00%
22 100.00% 100.00% 100.00%
23 100.00% 100.00% 100.00%
24 100.00% 100.00% 100.00%
25 100.00% 100.00% 100.00%

While a sweep would obviously be great for the Sioux, even a split would give UND about a 69% chance of leaving the weekend #14 or higher.

Who Sioux fans should watch

Here are the outcomes that result in an average move of at least .75 PWR spots for UND across the simulations, sorted by UND outcome so you know which are defensive. Lists are in order of importance.

If UND sweeps:

  • Alaska-Anchorage over Alaska (sweep)
  • Colorado College over Minnesota-Duluth (sweep)
  • Notre Dame over Michigan St (sweep)
  • Northeastern over Maine (at least one)
  • Nebraska-Omaha over Minnesota (at least one)

If UND splits:

  • Alaska-Anchorage over Alaska (sweep)
  • Mass.-Lowell over Merrimack (at least one)
  • Nebraska-Omaha over Minnesota (at least one)
  • Lake Superior splits with Northern Michigan

If UND gets swept:

  • Alaska-Anchorage over Alaska (at least one)
  • Mass.-Lowell over Merrimack (sweep)
  • Ferris St. over Western Michigan (at least one)
  • Michigan St. over Notre Dame (at least one)
  • Minnesota-Duluth over Colorado College (at least one)

This being only the second week I’ve split the “what to watch” by UND outcome, it’s interesting to see how what maximizes UND’s outcome for the week changes based on UND’s own performance. If UND sweeps, Sioux fans will be cheering for Colorado College and Notre Dame to knock off bigger dogs.

With a one-week outlook, though, CC and ND will be nipping at our heels if the Sioux lose, such that our one-week PWR would be maximized by each losing at least one game. However, to make the tournament UND needs to be looking up the ladder not down, so our overall final PWR outcome still probably draws the most benefit from those lower ranked teams sweeping those higher ranked teams.

Methodology

Each forecast is based on at least a million monte carlo style simulation of the remaining games in the regular season. For each simulation, the PairWise Ranking (PWR) is calculated and the results tallied. The probabilities presented in the forecasts are the share of simulations in which a particular outcome occurred.

The outcome of each game in each simulation is determined by random draw, with the probability of victory for each team set by their relative KRACH ratings. So, if the simulation set included a contest between team A with KRACH 300 and team B with KRACH 100, team A will win the game in very close to 75% of the simulations.

Resources

Weekend Preview: North Dakota vs. Michigan Tech

One of these teams, but likely not both, will be at home for the first round of the WCHA playoffs in March.

For North Dakota, it would be their tenth consecutive home playoff series, the longest active streak in the league. Michigan Tech has never hosted the first round of the conference tournament under the current fomat.

The Huskies sit one point back of 6th place UND in the race for home ice. Colorado College and Nebraska-Omaha are tied for 4th place, one point ahead of North Dakota. The top six teams in the final WCHA standings will earn home playoff games.

It would be easy for the casual fan to overlook first year head coach Mel Pearson and his Michigan Tech squad, given the fact that UND has taken the last ten meetings between the teams by a combined score of 53-14. But MTU is improved in every area – scoring offense, scoring defense, power play, and penalty kill – and expect to have junior forward Milos Gordic (8-5-13 in 20 games) back for this series.

For the record, Mel Pearson spent the previous 23 seasons as an assistant coach at Michigan and was behind the bench for the Wolverines 2-0 Frozen Four victory over North Dakota last April. MTU assistant coach Bill Muckalt and goaltending coach Steve Shields are former Michigan players. Pearson played his college hockey at Michigan Tech.

North Dakota continues to roll out the only healthy bodies left in the locker room, and have gone 12-4-1 in the last 17 games. After a torried 6-2-1 start, Michigan Tech is a pedestrian 6-9-2 in the past 17.

For UND, junior goaltender Aaron Dell has played the majority of minutes this season, but look for Dell and senior netminder Brad Eidsness to split starts this weekend.

It’s a bit of an unusual end to the regular season for the Green and White: after hosting Michigan Tech in the first two meetings between the teams this year, North Dakota plays at Denver and vs. MSU-Mankato to close out the schedule, two other teams UND has not faced all season.

After next season (2012-13), it is unclear whether North Dakota and Michigan Tech will continue their storied rivalry. UND will move to the National Collegiate Hockey Conference, while MTU will remain in the WCHA and maintain ownership of the historic MacNaughton Cup.

Michigan Tech Team Profile

Head Coach: Mel Pearson (1st season at MTU, 13-14-3, .483)
Pairwise Ranking: NR
National Rankings: NR/NR
This Season: 13-14-3 overall, 10-9-3 WCHA (7th)
Last Season: 4-30-4 overall, 2-24-2 WCHA (12th)

Team Offense: 3.07 goals scored/game
Team Defense: 3.00 goals allowed/game
Power Play: 20.6% (28 of 136)
Penalty Kill: 83.8% (109 of 130)

Key Players: Senior F Brett Olson (9-18-27), Senior F Jordan Baker (9-16-25), Junior F Milos Gordic (8-5-13), Freshman F David Johnstone (9-14-23), Junior D Steven Seigo (3-16-19), Sophomore D Daniel Sova (2-9-11), Senior G Josh Robinson (12-11-3, 2.85 GAA, .909 SV%, 3 SO)

North Dakota Team Profile

Head Coach: Dave Hakstol (8th season at UND, 203-104-29, .647)
Pairwise Ranking: t-15th
National Rankings: #14/#15
This Season: 16-11-2 overall, 12-10-0 WCHA (6th)
Last Season: 32-9-3 overall (NCAA Frozen Four semifinalist), 21-6-1 WCHA (1st)

Team Offense: 3.07 goals scored/game
Team Defense: 2.79 goals allowed/game
Power Play: 21.3% (29 of 136)
Penalty Kill: 81.5% (101 of 124)

Key Players: Junior F Danny Kristo (14-17-31) Junior F Corban Knight (8-18-26), Sophomore F Brock Nelson (20-12-32), Freshman D Nick Mattson (5-10-15), Senior D Ben Blood (2-12-14), Junior G Aaron Dell (12-9-2, 2.80 GAA, .890 SV%, 1 SO)

By The Numbers

Last meeting: March 12, 2011 (Grand Forks, ND). In the second and decisive game of the WCHA first-round playoff series, UND battled a tough Michigan Tech squad and secured a 3-1 victory to advance to the WCHA Final Five in St. Paul, MN. Two second period goals in the span of two minutes erased an early 1-0 Michigan Tech lead. North Dakota had won the previous three meetings between the teams by a combined score of 25-3.

Most Important Meeting: The Sioux and Huskies have never met in the NCAA tournament, so I will go with the most important meeting that never was: in 1965, the Sioux lost to Boston College, 4-3, one game short of the national championship game, where they would have faced the Michigan Tech Huskies, who won the second of their three titles by defeating the Eagles. UND settled for third place that season, downing Brown University, 9-5. North Dakota went 13-3-0 in the regular season in 1964-65, with two of those three losses coming at the hands of Michigan Tech.

All-time Series: UND leads the all-time series, 144-90-9 (.611), including a 81-33-4 (.703) record in games played in Grand Forks. The teams first met in 1948.

Last Ten: UND has won the last ten games between the teams. The last time the Huskies earned a point against North Dakota was back in January 2009, when the teams skated to a 3-3 tie in Houghton. North Dakota avenged the tie with a 5-0 drubbing the following night. The Fighting Sioux have outscored the Huskies 53-14 in the last ten games.

Game News and Notes

UND head coach Dave Hakstol is 22-5-1 (.804) in his coaching career against Michigan Tech. MTU has picked up points in four of five road series this season. Bemidji State is the only WCHA team to sweep the visiting Huskies this year. North Dakota junior forward Carter Rowney is on a tear this season, potting twelve goals this season (29 games) after collecting just four goals in his first two years at UND (67 games).

The Prediction

The Huskies are eager to bring their new look to Engelstad Arena, and Friday’s first period will tell the tale. Both games will be close, and Michigan Tech could earn a point or two this weekend, but UND has been focused, particularly at home. UND 4-3, 5-3.

Sioux looking for sweep to bolster PairWise Ranking

With just 6 games left in the regular season, UND’s PWR outlook remains pretty clear. Consistent with last week’s forecast (that UND could lose two more and likely be in the top 13 at the end of the regular season) and results (one loss), this week’s forecast shows that UND can only lose one more and still be more likely than not to finish the regular season top 13.

However, as also revealed last week, if UND loses two more, the Sioux are right on the cusp (a 47% chance of being #14 or higher) such that a good result and/or a little bit of luck in the WCHA tournament could be enough to push the Sioux into the NCAAs.

Presented a little differently, here are UND chances of being at or above each rank at the end of the regular season based on the number of remaining games the Sioux win:

PWR
Rank
Win 2 Win 3 Win 4 Win 5 Win 6
1 0.00% 0.00% 0.00% 0.00% 0.01%
2 0.00% 0.00% 0.00% 0.00% 0.10%
3 0.00% 0.00% 0.00% 0.00% 1.10%
4 0.00% 0.00% 0.00% 0.02% 6.72%
5 0.00% 0.00% 0.00% 0.23% 23.02%
6 0.00% 0.00% 0.00% 1.56% 51.30%
7 0.00% 0.00% 0.01% 6.03% 78.00%
8 0.00% 0.00% 0.06% 16.51% 93.08%
9 0.00% 0.00% 0.33% 33.75% 98.37%
10 0.00% 0.00% 1.35% 55.06% 99.73%
11 0.00% 0.00% 4.48% 75.34% 99.96%
12 0.00% 0.02% 12.21% 89.36% 100.00%
13 0.00% 0.18% 26.55% 96.59% 100.00%
14 0.00% 1.02% 46.97% 99.20% 100.00%
15 0.02% 4.25% 68.87% 99.87% 100.00%
16 0.16% 12.70% 85.82% 99.99% 100.00%
17 0.93% 28.49% 95.32% 100.00% 100.00%
18 3.73% 49.73% 98.93% 100.00% 100.00%
19 11.86% 71.49% 99.83% 100.00% 100.00%
20 28.10% 88.11% 99.98% 100.00% 100.00%

Remember that once the regular season is finished, UND still has a chance to play up to about five more games in the conference tournament.

End of regular season outlooks for other WCHA teams on the bubble

Colorado College is in a slightly worse spot than the Sioux. Losing just one more gives the Tigers a 71% chance of finishing #13 or higher, while losing 2 more leaves CC with only a 3% chance of finishing #13 or higher.

Minnesota, in contrast, is in a slightly better spot than the Sioux. Even with two more losses, the Gophers stand a 79% chance of being top 13 at the end of the regular season. With three more losses that plummets to 6.8%, while with only a single loss that rockets to 99.2%.

One week outlook

The Sioux, once again, face a large spread in their possible PWR outcomes for the weekend. A sweep is most likely to push the Sioux into the 20-22 range, while getting swept is likely to drop them as much as ten spots.

Ferris St., sitting on its first #1 PWR ranking, is going to have to work this weekend to hold onto it. Even with a sweep, the Bulldogs have only a 35% chance of staying #1, while with a split that likelihood drops to 9%. The series, other than their own, which would be most beneficial to Ferris St this week is Merrimack defeating Boston College.

Minnesota faces an even bigger spread than UND. The Gophers have big stakes in quite a few games this week, cheering for (in order of importance):

  • Wisconsin over Denver
  • St. Cloud over Alaska Anchorage
  • Boston College over Merrimack
  • Massachusetts over Maine

Finally, Colorado College is the only one of the three WCHA bubble teams that is unlikely to move into tournament position this weekend, even with a sweep.

Methodology

Each forecast is based on at least a million monte carlo style simulation of the remaining games in the regular season. For each simulation, the PairWise Ranking (PWR) is calculated and the results tallied. The probabilities presented in the forecasts are the share of simulations in which a particular outcome occurred.

The outcome of each game in each simulation is determined by random draw, with the probability of victory for each team set by their relative KRACH ratings. So, if the simulation set included a contest between team A with KRACH 300 and team B with KRACH 100, team A will win the game in very close to 75% of the simulations.

Resources